
Introduction to 10 Must-Know Basic Economic Concepts for AP® Macroeconomics and Microeconomics
Have you ever liked a person who you see in the neighborhood or at school but frankly know nothing about? Your friends probably told you that the best way to get a date with your “crush” was to begin by understanding their basics. After that, you could meet and hopefully you’d get a date.
The same holds for AP® Economics. You may consider yourself clueless or have only been hearing about it. But, with a good foundation of the basic economic concepts, you can excel in the course. Here’s the deal: if you read through this article, you won’t have to be nervous about your upcoming date with AP® Microeconomics multiple-choice questions and AP® Microeconomics FRQs.
This article is a comprehensive AP® Microeconomics review defining the ten most important basic economic concepts. It offers examples so that you can easily recall.
Let’s start off with the first basic economics concept.
Scarcity and Choice
Economics is described as the science of choice, centered on the principle that society has unlimited wants but depends on scarce resources. Therefore, decisions are made to maximize satisfaction. For example, many people would like to own a Ferrari, but most settle for cars which they can afford.
Every society must answer the following questions in regards to the dispensation of scarce resources:
- What commodities to produce?
- How should these goods be produced?
- For whom should they provide products?
Economists assume that these choices are made rationally and in self-interest.
Scarcity causes people and firms to pick suitable alternatives at the cost of the less preferred options creating opportunity costs and trade-offs.
Trade-offs and Opportunity Cost
As mentioned earlier, economic decisions involve trade-offs between one product and another or using scarce resources in one way or another. When we make an economic decision, the next best but forgone alternative is known as the opportunity cost. For example, if you invest in stocks at the expense of bonds, the interest that bonds earn would be your opportunity cost of investing in stocks.
Economic choices affect production and influence the society’s economic activities. To understand how the opportunity costs are used to optimize output, production possibility graphs are used. Let’s have a look at this as a basic economic concept.
Production Possibility Graphs
One of the most important basic economic concepts and chart in AP® Economics is the production possibility graph. It is a model that demonstrates alternative combinations of output that an economy can produce. The model is based on the concept of opportunity cost, trade-offs, and scarcity.
When drafting the model, it is assumed that: the economy produces only two goods, there are no changes in the factors of production and the technology level, and capital intensity remains constant (ceteris paribus).
Here’s an example of this basic economic concept.
A local bakery in a small town can make either pizza or bread using its single oven and can only operate during the daytime. Below are the bakery’s production possibilities per hour of operation:
| Pizza | 0 | 2 | 4 | 6 | 7 |
| Loaves of Bread | 30 | 27 | 20 | 10 | 0 |
When we chart the possibilities, we see that production of pizza is inversely related to the manufacture of bread. If the resources are readily adaptable to the different products (equipment, skill of the laborers, availability, and cost of ingredients), the curve formed will be a straight line, although this is not common.
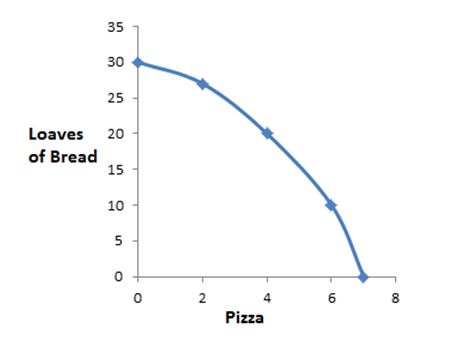
The most typical scenario is when resources cannot quickly adapt to changes, creating a concave curve. This is attributed to the law of increasing opportunity costs which states that as you increase production, the opportunity cost increases.
Changes in the factors of production such as capital, labor or technology cause production possibilities curves to shift. In the above example, if the bakery gets another oven (capital intensity) or a more efficient model (technology) the curve will move to the right.
The production possibilities curve depicts the opportunity costs and trade-offs of how an economy utilizes the factors of production. Let’s see more on the concept of factors of production.
Factors of Production
There are four main factors of production in any economy. These are:
- Land: Comprise of all exploitable resources found on earth such as crude oil.
- Capital: These are the physical apparatuses and equipment employed in the process of production.
- Labor: These are the people who work or the human skills applied to facilitate production.
- Entrepreneurs: These are the people who identify new opportunities or mobilize resources for business or bring products to markets to meet the needs of society
An economy is said to be in full production when resources are used efficiently, at the lowest possible cost (productive efficiency) to address the particular needs of the society (allocative efficiency). Trade-offs are made to maximize the productive and allocative efficiency by the concept of marginal analysis of each choice. Below is more on what is marginal analysis.
Marginal Analysis
This basic economic concept assumes that the additional benefit of a commodity diminishes with every extra unit consumed.
For example, suppose it’s at the height of summer and you’ve been out all day. If you take a bottle of soda, the first one will give you the maximum benefit. However, a third, fourth or fifth bottle will not give you as much satisfaction as the first one did. Although you probably got some benefit from the fourth soda, the extra value diminishes with every additional unit consumed.
This concept also applies to economic decisions and influences production and consumption patterns in a free market system.
Economic Systems
Producer and consumer choices are the core determinants of market systems. However, they are not the only determinants. The government can also influence these choices and affect the a country’s economic system.
When the government acts as an impartial referee in what is also known as Laissez Faire, the system is also referred to as a free market or a capitalist economy. On the other hand, if the government reserves the right to ownership of all resources and regulates what is produced, how much is produced and for whom? The economic system is known as a controlled market or centrally planned economy. A mix of the two extremes is called a mixed market system.
Economists believe that free markets offer the most efficient way to organize economic activity. One of the analogies used to explain the allocation of resources in a free market system is the concept of supply and demand. Here’s more on this.
Supply, Demand and Market Equilibrium
Markets are points of interaction between buyers (demanders) and sellers (suppliers) for the purpose of exchange of commodities for value. One of the key points of interaction between sellers and buyers is the price. Supply describes the quantity of a product that will be provided at specific prices. Demand, on the other hand, describes the amounts that the buyers will purchase at specific prices.
Demand and price have an inverse relationship, while supply is directly proportionate to price. Thus a demand curve is downward sloping, and a supply curve is upward sloping. The intersection of a demand and a supply curve is known as the market equilibrium. At this point, the economy experiences full production and full employment.
A circular flow model explains the relationships in an economy more elaborately. It is described in the next section.
Circular Flow Model
This is a basic economic concept where the economy is taken as comprising of two groups, the households, and the firms. The two groups interact in two markets, the commodities market and the labor markets.
In a commodities market, the firms sell produce to the people and receive payments, while in the labor markets, the households sell workforce to the businesses and receive salaries and wages.
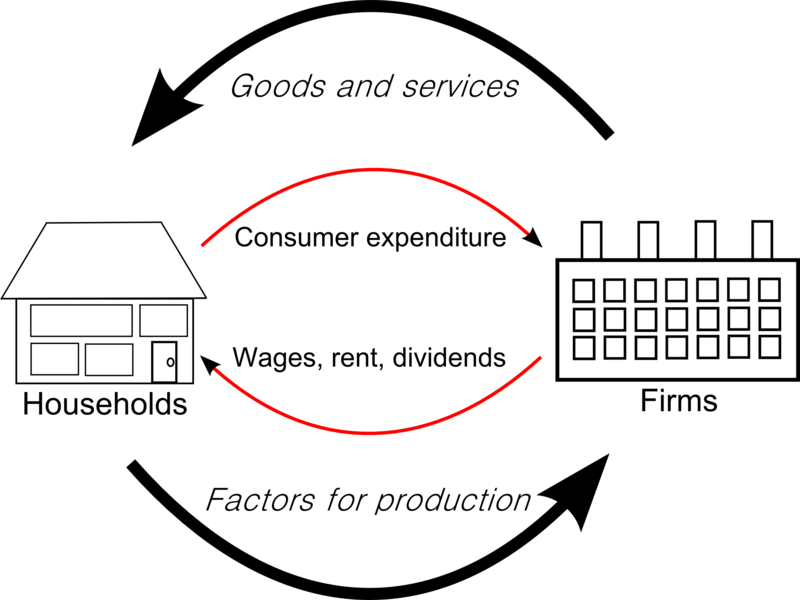
In reality, however, these relationships are more complex and involve many different types of labor and commodity markets. The circular flow chart simplifies these relationships and makes it easier to comprehend.
Property Rights and Incentives
The government exercises market power through incentives thereby influencing production. For instance, governments can offer tax breaks and transfer payments to encourage labor supply to low paying jobs.
Property rights, on the other hand, are used to govern the exploitation and subsequent production such as rights of fishing. They are issued with time frames that enable sustainable extraction of the resources and ensure the entrepreneur receives an incentive to supply a commodity.
The government can also give producers incentives such as tax breaks or fees waivers to encourage production of certain goods.
Decisions to promote a particular line of production are usually made to optimize an economy’s trading position internationally by maximizing on the most efficiently produced commodities. Here’s a look at international trade as a basic economic concept.
International Trade
Different countries exchange various products to meet the demands within their borders. A state will seek to purchase (import) products which it least efficiently produces and focus on providing, and hopefully export, commodities that it can cheaply produce.
When two countries trade, one country can have a comparative or an absolute advantage over the other. The concept of opportunity cost and production possibility graphs is used to establish this. Both countries can use this principle to identify the circumstances which mutually beneficial trade can occur.
Comparative advantage is established by evaluating the differences in opportunity costs between two countries. For example, if we have wheat and sugar on the production possibility curves of the U.S. and Brazil, and the U.S. needs 2 tons of sugar to make a ton of wheat while Brazil needs 1.5 tons. Brazil has a comparative advantage over the U.S. in the production of sugar.
Let’s wind up on this informative AP® Microeconomics study guide. Remember, economic concepts are broadly similar in both micro and macroeconomics. This article highlighted the ten most important basic economic concepts for your AP® Economics review, and if you’ve read all of this, you’ll have a good time with your date.
Let’s put everything into practice. Try this AP® Microeconomics practice question:

Looking for more AP® Microeconomics practice?
Check out our other articles on AP® Microeconomics.
You can also find thousands of practice questions on Albert.io. Albert.io lets you customize your learning experience to target practice where you need the most help. We’ll give you challenging practice questions to help you achieve mastery of AP Microeconomics.
Start practicing here.
Are you a teacher or administrator interested in boosting AP Microeconomics student outcomes?
Learn more about our school licenses here.


