
The old saying that a picture is worth a thousand words applies to mathematics, too. However, it might be more appropriate to say that a picture is worth a thousand calculations. Sometimes, it’s just easier to see a solution on a graph. Solving systems of equations by graphing can often be the quickest method.
How to Solve a System of Equations by Graphing
A system of equations involves two or more equations. Each of the equations must have two or more variables, for example, x and y. When a system of equations is graphed, the solution will be all points of intersection of the graphs.
So, how do you solve systems of equations by graphing? The steps involved in solving a system of equations by graphing are simple:
- Graph each equation.
- Identify the coordinates of the intersection(s) of the graphs, if any exist.
- Check your work by substitution.
Solving Systems of Linear Equations by Graphing
Solving systems of equations by graphing might feel familiar. All we really need to do is graph linear equations. When graphing linear equations, it helps if the equations are written in slope-intercept form, y=mx+b, where m is the slope and b is the y-intercept.
To graph an equation from slope-intercept form, we first mark a point on our graph at the coordinates of the y-intercept. This point will be on the y-axis. Then, we can use the slope (the rise over run) to guide us to the next point. Finally, we connect the points to draw the line. When graphing a system of linear equations, we will have to complete this process twice, once for each line.
One Solution Graph
Let’s solve our first system of equations by graphing.
y=x+1
y=2x-1
First, notice the equations are already in slope-intercept form. We can jump into graphing each equation.
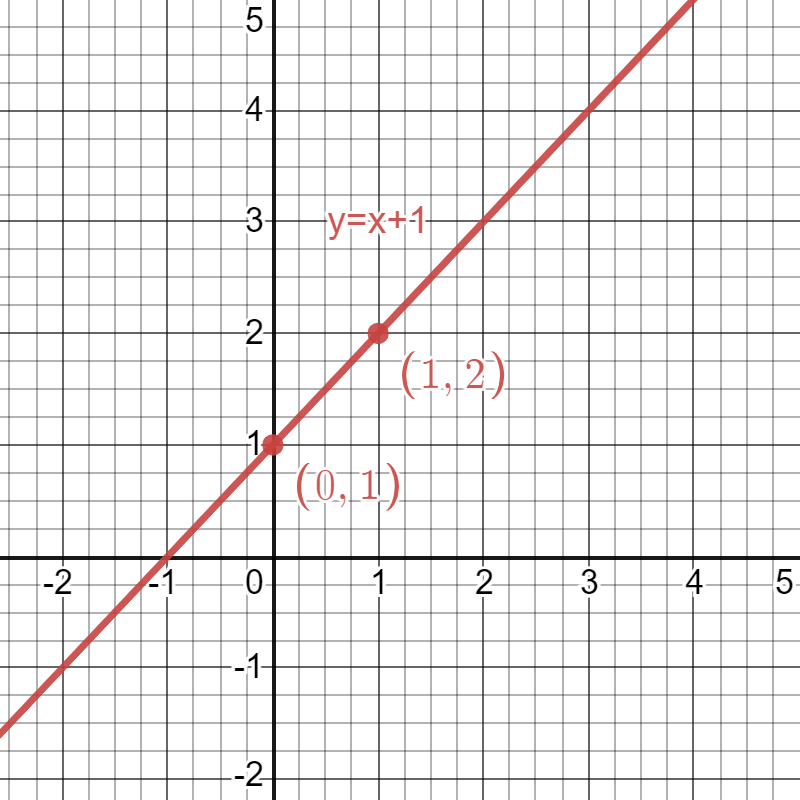
For the first equation, y=x+1, the y-intercept (b) equals 1. Therefore, we can plot a point at (0,1). The slope (m) also equals 1. However, it may help to think about m in fraction form, as \frac{1}{1}. From our first point, we can rise up 1 unit and run right 1 unit to plot a second point at (1,2). Last, we connect the points to complete the line.
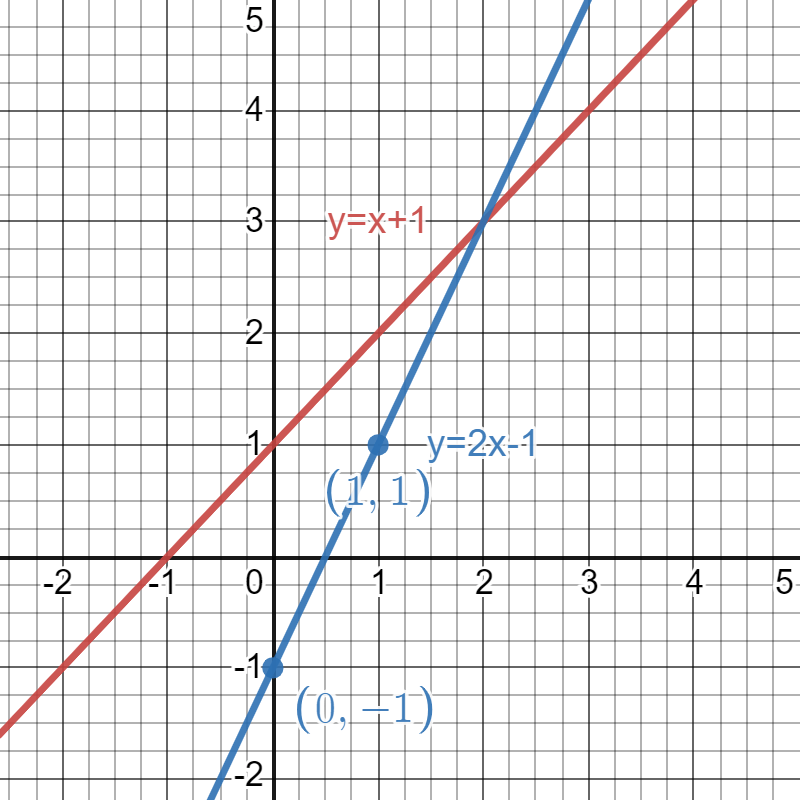
Now, we add the graph of the second equation, y=2x-1. This time, the y-intercept, b, equals -1. So, we can plot the first point at (0,-1). The slope, m, equals 2, which we can think about as \frac{2}{1}. Therefore, we can rise up 2 units and run over 1 unit from the y-intercept to plot a second point at (1,1). Finally, we can connect the points to complete the second line.
The solution to this system of linear equations is the point of intersection of the two graphs, which occurs at (2,3). We can see that this is the only solution to the system of equations since the lines do not intersect at any other points.
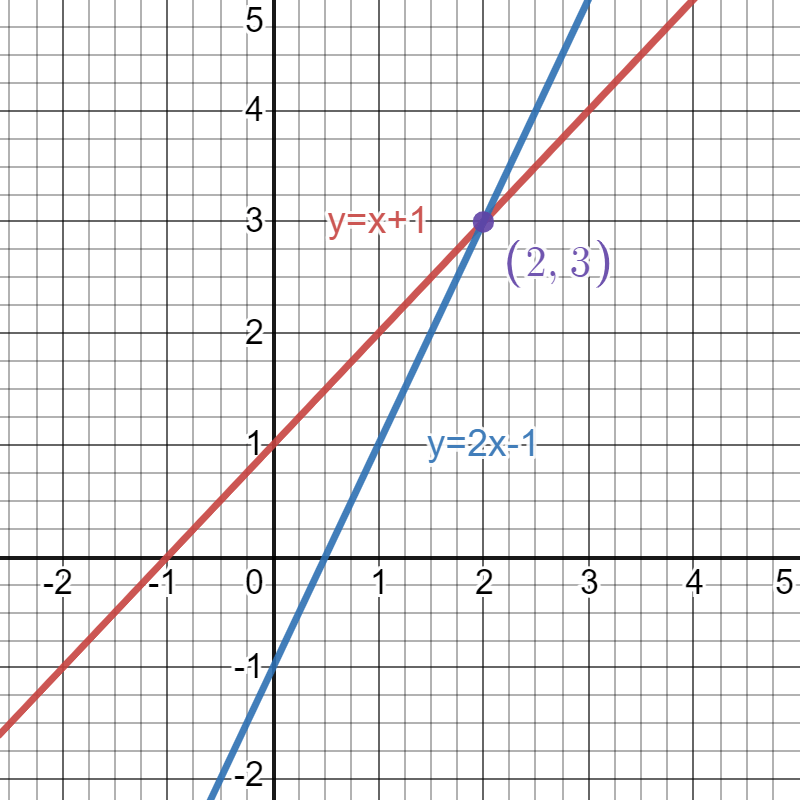
Finally, we can use algebra to confirm the system of equations solution graph. We will substitute the values \color{red}{2} and \color{blue}{3} for \color{red}{x} and \color{blue}{y} into one or both of our equations.
| y=x+1 {\color{blue}{3}}={\color{red}{2}}+1 3=3 | y=2x-1 {\color{blue}{3}}=2({\color{red}{2}})-1 3=4-1 3=3 |
Both substitutions result in true equations, so our solution must be correct.
Infinitely Many Solutions Graph
Next, let’s graph a system that intersects at more than one point.
y=-x-2
2x+2y=-4
The first equation here is already in slope-intercept form. However, the second is in standard form, Ax+By=C. First, we’ll rewrite this equation in slope-intercept form to make it easier to graph.
2x+2y=-4
{\color{red}{\frac{1}{2}}}(2x+2y)={\color{red}{\frac{1}{2}}}(-4)
x+y=-2
x+y{\color{red}{-x}}=-2{\color{red}{-x}}
y=-x-2
Now that both equations are in slope-intercept form, we realize something that might not have been apparent before. These equations are the same! We can use the same process to graph both equations.
- Plot a point at (0,-2) because the y-intercept is -2.
- Since the slope is -1, move down 1 unit and run 1 unit right to mark another point at (1,-3).
- Connect the points to complete the line.
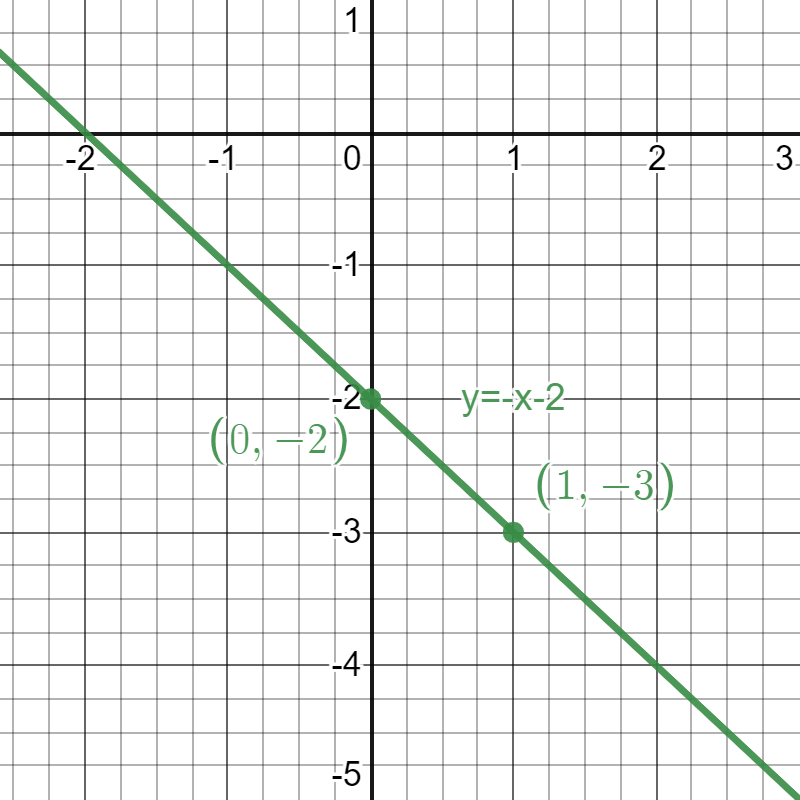
Notice that the graphs of both equations overlap entirely. In this case, there are infinitely many solutions to the system of equations. All the points on one line are also on the other line, and both lines extend infinitely in each direction. So, there are an infinite number of coordinates that satisfy both equations.
We can substitute any point from the line into the equations to get a true statement. For instance, let’s try ({\color{red}{-1}},{\color{blue}{-1}}).
y=-x-2
{\color{blue}{-1}}=-{\color{red}{(-1)}}-2
-1=-1
This equation is true, so we’ve confirmed that ({\color{red}{-1}},\color{blue}{-1}) is one solution to the system. However, we cannot repeat this method to check our work for an infinite number of solutions. Instead, we can substitute one equation into the other to check our work. Since y is already isolated in y=-x-2, we will substitute that equation into 2x+2y=-4.
2x+2({\color{red}{-x-2}})=-4
2x-2x-4=-4
-4=-4
When we encounter this situation, where our variables have been eliminated and we are left with a true statement, we conclude that there are an infinite number of solutions to the system of equations.
For a review on solving systems of equations by substitution, check out this blog post.
No Solutions Graph
Finally, let’s graph a system where the lines do not intersect.
y=-\dfrac{3}{2}x-1
y=-\dfrac{3}{2}x+\dfrac{1}{2}
These equations are both written in slope-intercept form, so we can graph them without manipulation.
For the first equation, we plot a point at the y-intercept, (0,-1). Then, we use the slope of \frac{-3}{2} to move down 3 units and run over 2 units to the next point, (2,-4). Last, we complete the line by connecting the points.
For the second equation, we mark a point at the y-intercept, (0,\frac{1}{2}). Again, our slope is \frac{-3}{2}. Therefore, we move down 3 units and run over 2 units to the next point at (2,-2.5). Then, we connect the points to complete the line.
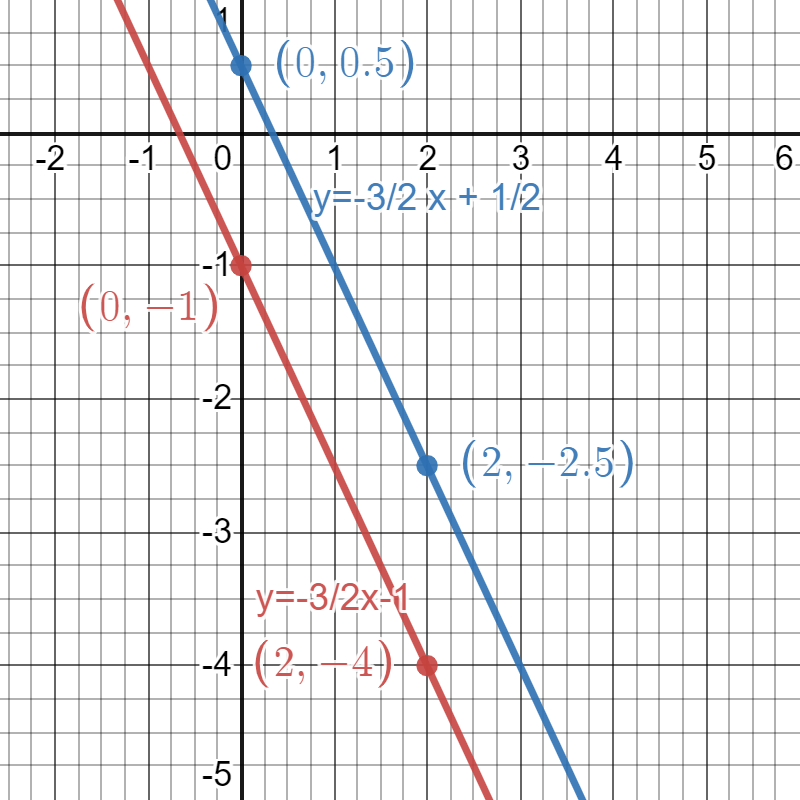
From the graph, we can see that this system of linear equations consists of parallel lines. By definition, parallel lines never intersect. So, no point will satisfy both equations in this system. We solved a no-solution system by graphing.
We can confirm this system has no solution algebraically. Again, since we aren’t checking a specific set of x and y coordinates, we will instead substitute one equation into the other.
-\dfrac{3}{2}x+\dfrac{1}{2}=-\dfrac{3}{2}x-1
-\dfrac{3}{2}x+\dfrac{1}{2}+{\color{red}{-\dfrac{3}{2}x}}=-\dfrac{3}{2}x-1+{\color{red}{-\dfrac{3}{2}x}}
\dfrac{1}{2}=-1
Since the resulting equation is not true, there are no points that we could substitute for x and y that would satisfy both equations. Therefore, there are no solutions to this system of equations.
Solving Systems of Equations by Graphing Calculator
Solving systems of linear equations by graphing calculator helps us quickly spot the solution to a system of equations.
To graph a system on most graphing calculators, select “y=” and type in the linear equation in slope-intercept form. Then, hit graph. Repeat this process to add a second line. Finally, use the trace function to isolate the point or points of intersection. Online tools like Desmos and Geogebra also offer online graphing calculators which can graph even the most complex equations written in any form.
Check out the video tutorials in the table below for a more detailed walkthrough of graphing systems of equations with a calculator.
| Graphing Systems of Equations on TI-84 | Link Here |
| Graphing Systems of Equations Desmos | Link Here |
| Graphing Systems of Equations Geogebra | Link Here |
Solving Systems of Equations by Graphing: Keys to Remember
- Systems of equations can be solved by graphing, where the solution is the point(s) of intersection of the graphs.
- Solutions can be checked algebraically by substitution.
- Systems of linear equations may have zero, one, or infinite solutions.
- Online graphing tools can quickly graph any equations.


