What We Review
Introduction
The tangent function is a fundamental concept in trigonometry, often introduced alongside sine and cosine functions. Its graph has a unique appearance characterized by periodic “walls” called asymptotes. Understanding and being able to manipulate graphing tangent with transformations is essential in many math courses, including AP® Precalculus. This guide will explore the tangent function and demonstrate how vertical and horizontal translations, as well as dilations, impact its graph.
Understanding the Basic Tangent Function
Definition of the Tangent Function
The tangent function, denoted as f(\theta) = \tan(\theta), originates from the ratio of the opposite side to the adjacent side of a right triangle. It is an essential part of trigonometry, repeating its pattern every \pi radians, which indicates its periodic nature.
Graphing the Basic Tangent Function
The graph of \tan(\theta) has several characteristics:
- Periodicity: The function repeats every \pi radians.
- Asymptotes: Vertical lines where the function approaches infinity but never actually reaches a value. These occur at \theta = \frac{\pi}{2} + n\pi for every integer n.
- Inflection Points: Points where the graph changes curvature, occurring at multiples of \pi.
Example
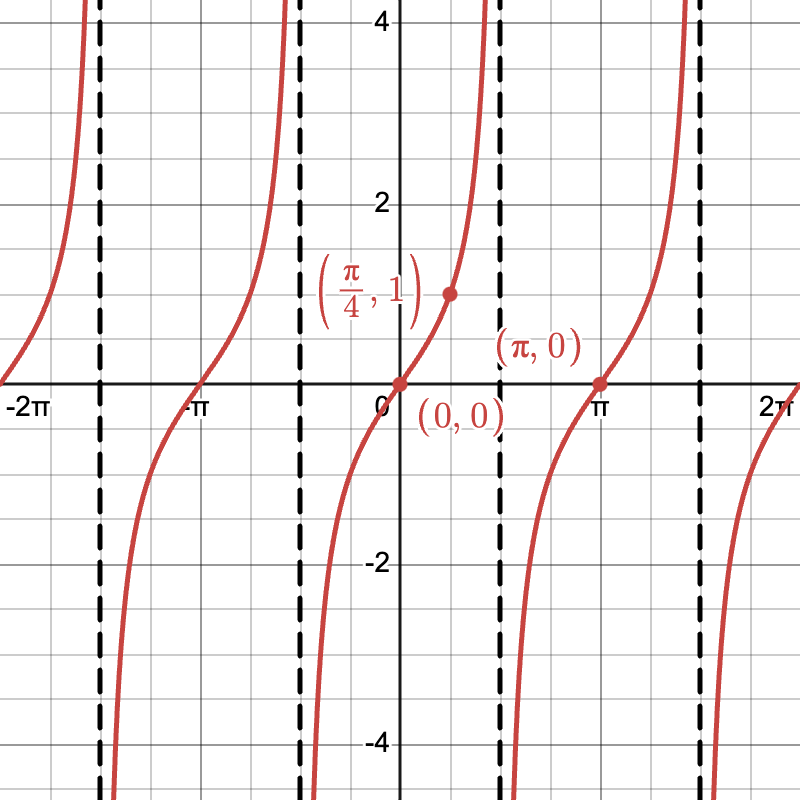
Let’s graph f(\theta) = \tan(\theta).
- Identify the Asymptotes: These are at \theta = \frac{\pi}{2} + n\pi.
- Plot Key Points: Calculate \tan(\theta) at 0, \frac{\pi}{4}, \pi.
- Draw the Curve: Sketch the periodic curve, respecting the asymptotes and key points.
Vertical Transformations
Vertical Translational Changes
The graph shifts up or down with vertical translations. The transformation is represented as g(\theta) = \tan(\theta) + d. Here, d determines the direction of the shift.
Example
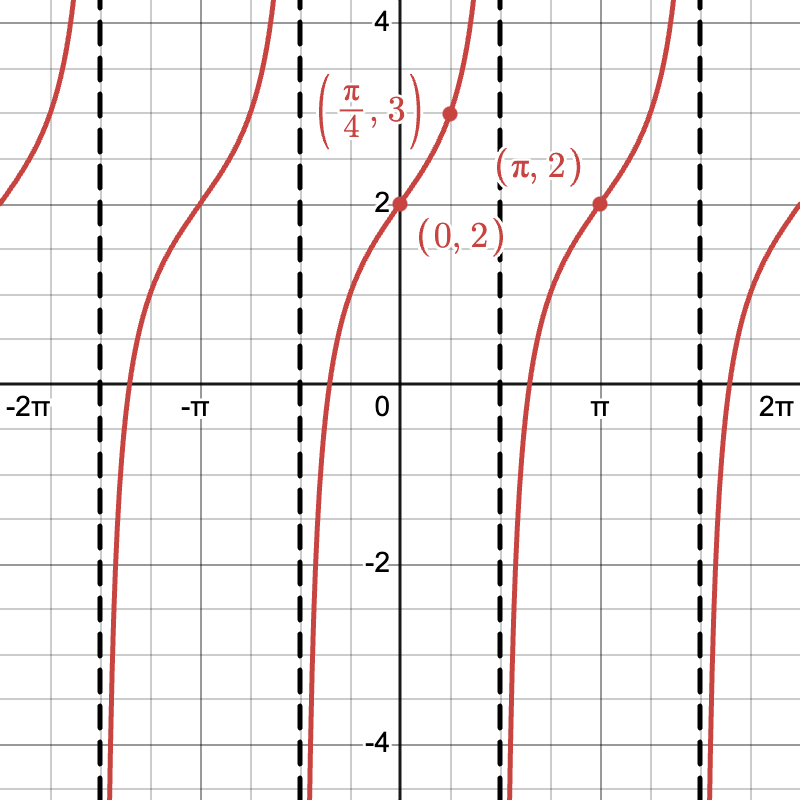
Graph the function g(\theta) = \tan(\theta) + 2.
- Baseline Graph: Start with f(\theta) = \tan(\theta).
- Shift Up by 2 Units: Add 2 to all y-values of the original graph.
Horizontal Transformations (Phase Shifts)
Horizontal Translational Changes
The graph can be moved left or right with horizontal shifts. The transformation is expressed as g(\theta) = \tan(\theta + c). The value of c determines the shift direction.
Example
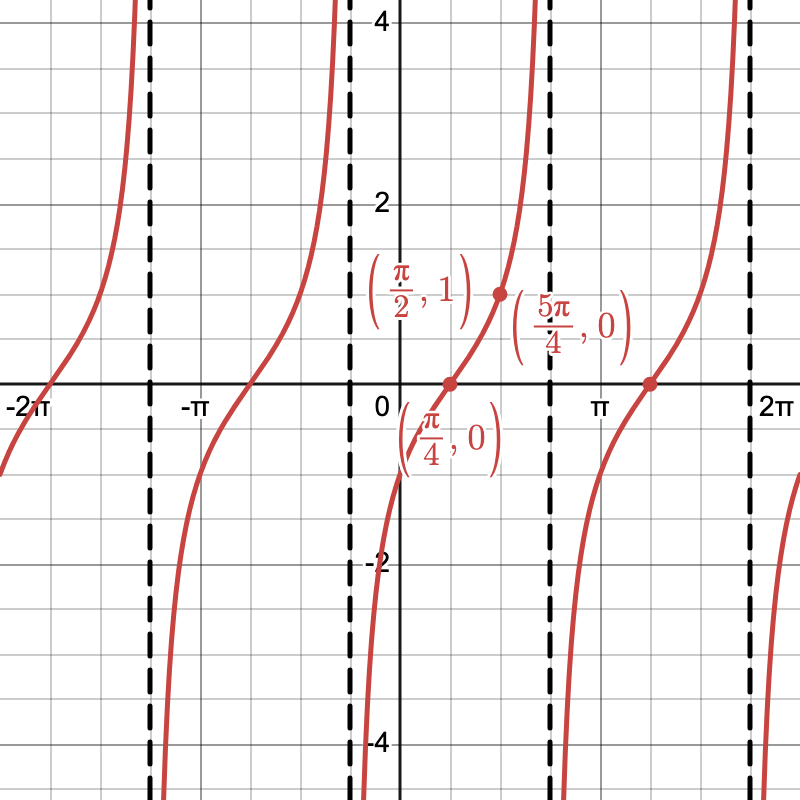
Graph g(\theta) = \tan(\theta - \frac{\pi}{4}).
- Base Graph: Begin with f(\theta) = \tan(\theta).
- Shift Right by (\frac{\pi}{4}): Move each x-value to the right by \frac{\pi}{4}, including the asymptotes.
Vertical Dilation
Understanding Vertical Dilation
Vertical dilation involves stretching or compressing the graph. The transformation is given by g(\theta) = a \tan(\theta), where |a| > 1 stretches and |a| < 1 compresses.
Example
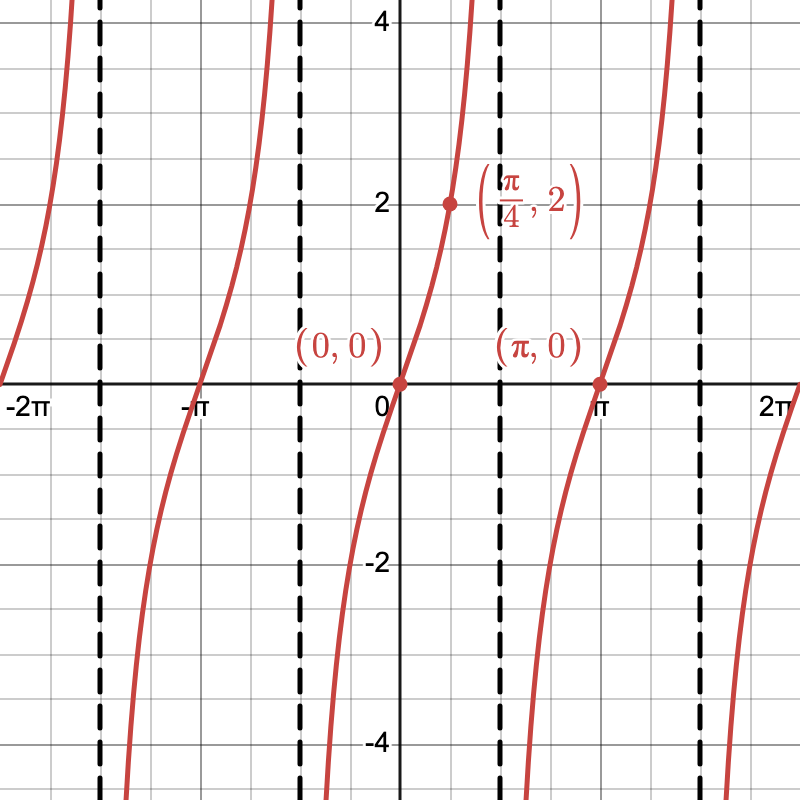
Graph g(\theta) = 2\tan(\theta).
- Original Graph: Start with f(\theta) = \tan(\theta).
- Vertical Stretch by Factor of 2: Multiply y-values by 2.
Horizontal Dilation
Understanding Horizontal Dilation
This transformation changes the period of the graph. Represented as g(\theta) = \tan(b\theta), where changing b adjusts the period to \frac{\pi}{b}.
Example
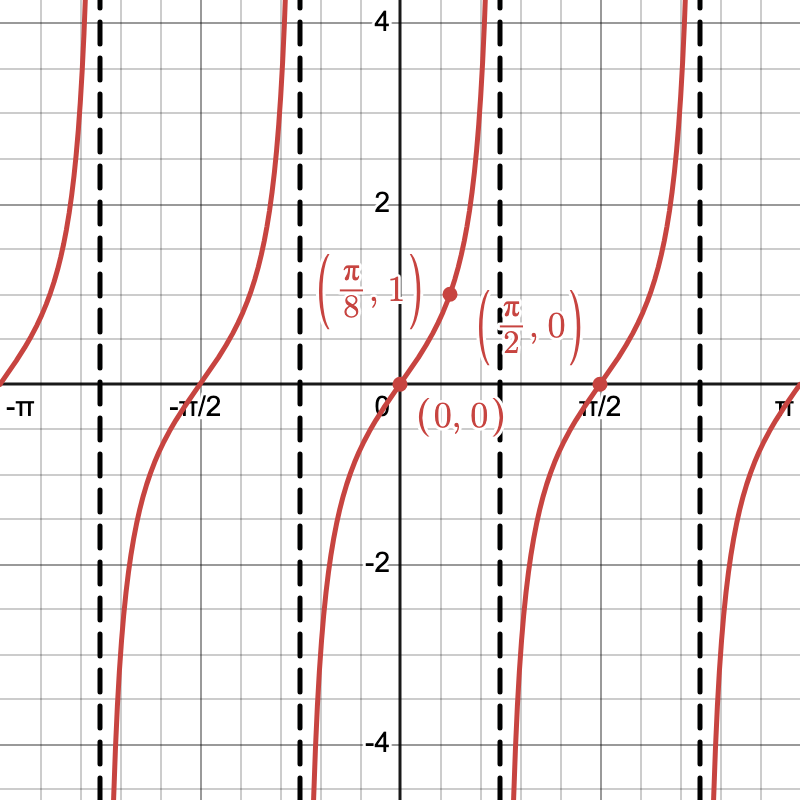
Graph g(\theta) = \tan(2\theta).
- Initial Function: Begin with f(\theta) = \tan(\theta).
- Period Reduction: Halve the period, resulting in periodicity at \frac{\pi}{2}.
Combining Transformations
Combined Transformations Overview
A function can be transformed using multiple operations, expressed as y = a \tan(b(\theta + c)) + d.
Impact of Each Component
- Vertical Translation: Applies the constant d.
- Phase Shift: Determined by c.
- Vertical Dilation: Multiplied by a.
- Horizontal Dilation: Affected by b.
Example
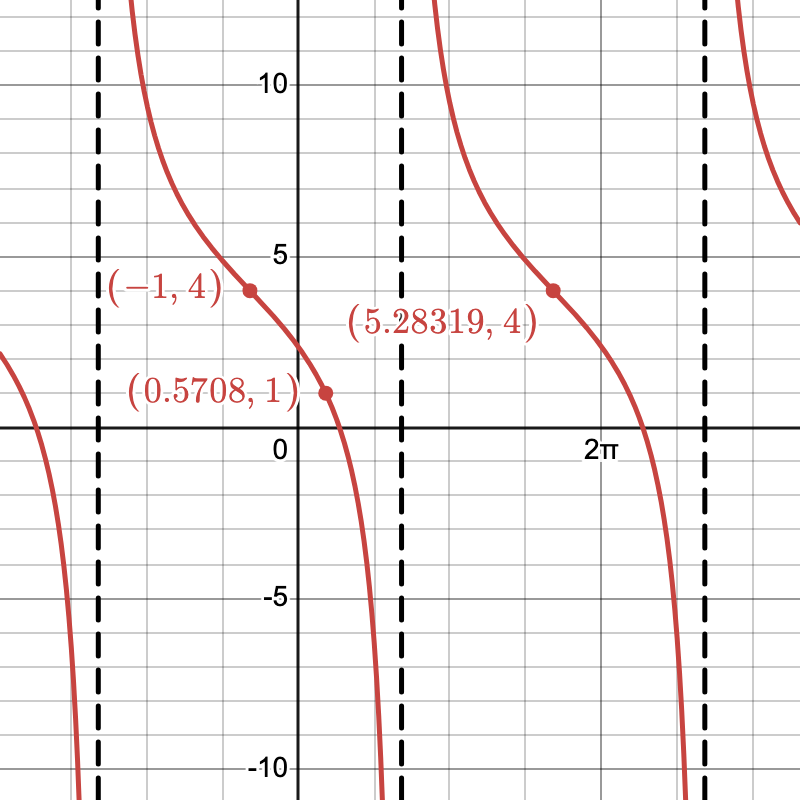
Graph g(\theta) = -3\tan(0.5(\theta + 1)) + 4.
- Start with Base Graph: Identify \tan(\theta).
- Apply Horizontal Dilation: Double the period.
- Shift Left by 1 Unit: Adjust x-values.
- Vertical Stretch by -3: Flip and stretch y-values.
- Shift Up by 4 Units: Add to y-values.
Quick Reference Chart
| Term | Definition |
| Tangent Function | f(\theta) = \tan(\theta), periodic, relates angles to trigonometric ratios. |
| Vertical Translation | Shifts graph up/down, \pm d. |
| Phase Shift | Shifts left/right, affected by c. |
| Vertical Dilation | Stretches/compresses, multiplied by a. |
| Horizontal Dilation | Alters period, affected by b. |
Conclusion
Mastering transformations of tangent functions equips students to tackle complex problems in trigonometry. Practice by experimenting with various transformations to deepen understanding. This guide serves as a starting point in graphing tangent with transformations effectively.
Sharpen Your Skills for AP® Precalculus
Are you preparing for the AP® Precalculus exam? We’ve got you covered! Try our review articles designed to help you confidently tackle real-world math problems. You’ll find everything you need to succeed, from quick tips to detailed strategies. Start exploring now!
Need help preparing for your AP® Precalculus exam?
Albert has hundreds of AP® Precalculus practice questions, free response, and an AP® Precalculus practice test to try out.


