
Phylogenies can look intimidating at first. However, understanding them is crucial for success in AP® Biology. This guide explores what phylogenies are, why they matter, and how to interpret them. It also includes examples, practice problems, and a quick reference chart of important terms.
What We Review
Introduction
Phylogenies are visual representations of how different organisms are evolutionarily related. They show the paths of species divergence and help biologists understand the origins of traits. Therefore, learning about phylogenies can reveal intriguing connections among organisms that might not be obvious otherwise.
In this article, each section builds on the previous one to give a clear picture of phylogenies. Next, the discussion moves from basic definitions to reading different phylogenetic diagrams. By the end, there will be a summary of essential vocabulary and a deeper understanding of these important biological tools.
What Is a Phylogeny?
A phylogeny defines the evolutionary history of a group of organisms. It shows how species branch off from common ancestors over time and how closely related they are. Researchers use fossil records, morphological traits, and molecular data to piece together this history.
In simpler terms, a phylogeny is similar to a family tree. However, instead of showing uncles and aunts, it illustrates relationships among species. Understanding phylogenies is important because it clarifies how inherited traits have evolved. This insight is useful for predicting how species might respond to environmental changes and helps explain the diversity of life on Earth.
Types of Phylogenies
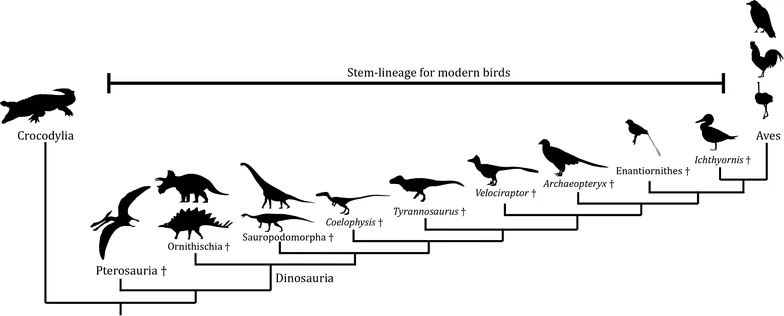
Phylogenetic Trees
A phylogenetic tree is a branching diagram that shows how different species are related through evolution. Each branch point, called a node, indicates where a single lineage splits into two. Therefore, if two species share a recent node, they are more closely related than those separating further down the tree.
Often, time is represented along the branches, with more recent events near the tips. The branching pattern reveals the order in which groups split.
Example: Constructing a Simple Phylogenetic Tree
Imagine four species of birds: A, B, C, and D. Suppose data show that Species A and B share more similarities in bone structure compared to C and D. Meanwhile, Species C and D have more genetic similarities to each other than to A or B.
Step-by-Step Solution:
- List key traits or genes (for instance, beak shape, bone structure, or DNA markers).
- Compare the traits pair by pair to see which species have the highest similarity.
- Place the most similar species closer together on the tree.
- Identify where branches diverge. Species A and B split from the ancestor they share with C and D earlier than C and D split from each other.
- Draw the nodes to indicate common ancestors.
As a result, A and B form one branch, while C and D form another. Species C and D share a recent ancestor, which is different from the older ancestor shared with A and B.
Cladograms
A cladogram is a simplified version of a phylogenetic tree. It focuses on shared, derived traits rather than showing precise evolutionary time. Therefore, a cladogram indicates the order in which groups split but does not always represent the amount of time or genetic distance between splits.
Each cladogram branch point is based on a derived characteristic (a new trait that appears in recent parts of a lineage but not in its older members). The main goal is to show how groups share or do not share specific traits.
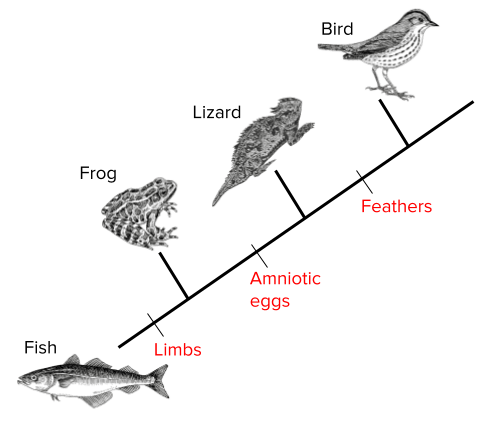
Example: Reading a Cladogram
Consider a cladogram showing four animals: Fish, Frog, Lizard, and Bird. Each branching point highlights a new feature (e.g., limbs, amniotic egg, feathers).
Step-by-Step Solution:
- Start at the base (Fish). Identify the derived trait that appears next (e.g., limbs) to see when the Frog branches off.
- Look for the next derived trait (e.g., amniotic egg). This indicates where Lizard branches off from organisms without amniotic eggs.
- Identify the final derived trait (e.g., feathers). This shows where birds split from the other lineages.
- Note how each trait is unique to specific groups.
Following these steps, it becomes evident that Fish lacks limbs, Frog has limbs, Lizard has an amniotic egg, and Bird has feathers in addition to the other features. Therefore, a cladogram helps track when each feature emerged.
Evidence for Constructing Phylogenies
Morphological Evidence
Morphology refers to the form and structure of organisms. Scientists often look at body shape, size, and specific features such as teeth or feathers. Therefore, morphological similarities can help place species into related groups. However, convergent evolution can make this challenging since unrelated species might look alike due to similar environments rather than shared ancestry.
Molecular Evidence
Molecular phylogeny relies on DNA, RNA, and protein sequence data. By comparing genetic codes, researchers can measure how many changes have accumulated between two lineages. Fewer differences indicate a closer relationship. This approach is powerful because genes change over time in relatively predictable ways.
Example: Comparing DNA Sequences
Suppose there are two species, X and Y, each with a short gene sequence of 10 nucleotides:
- Species X: A T C G A T C G A A
- Species Y: A T C G T T C G A A
Step-by-Step Solution:
- Compare each nucleotide position: (A vs. A), (T vs. T), (C vs. C), (G vs. G), (A vs. T), (T vs. T), (C vs. C), (G vs. G), (A vs. A), (A vs. A).
- Identify positions where they differ. Here, the 5th position is different (A in Species X, T in Species Y).
- Calculate the percentage of differences. In this case, only 1 out of 10 nucleotides is different, so the difference is (\frac{1}{10} \times 100%) = 10%.
- Conclude that because they have 90% similarity, Species X and Y share a close evolutionary relationship compared to species with lower sequence similarity.
Therefore, by checking how many nucleotides differ, scientists can infer how recently two species shared a common ancestor.
Interpreting Phylogenetic Trees and Cladograms
Understanding Nodes and Branches
Phylogenetic trees and cladograms both have branching points (nodes). Therefore, if two species share a node closer to the tips, it means they diverged more recently. If they share a node closer to the base, their split happened further back in time. In other words, branches represent lineages, and nodes mark speciation events or common ancestors.
Outgroups
An outgroup is a species or group that diverged before the lineage of interest. Biologists include outgroups to compare traits and determine which attributes are ancestral (present in the common ancestor) and which are derived (innovations in more recent lineages). Therefore, an outgroup provides a reference point, making it easier to see how certain traits arose.
Inferring Evolutionary Relationships
To analyze a phylogenetic tree or cladogram, begin at the base and move outward through each branching point. Observe how traits accumulate among lineages. However, note that longer branches in a phylogenetic tree may suggest a greater genetic distance or longer time period. In a cladogram, branch length typically does not represent time; it only indicates the sequence of divergences.
Real-World Applications of Phylogenies
Phylogenies matter beyond textbooks. For example, conservation biologists rely on these diagrams to identify which species are most genetically distinct. Therefore, they can prioritize species that represent unique evolutionary paths. In medicine, tracking the phylogeny of viruses reveals how they spread and change, helping researchers develop better vaccines. In agriculture, understanding the evolutionary history of crops allows scientists to breed plants with desirable traits more efficiently.
Phylogenies also guide ecological studies. Next time there is a discovery of a new organism, biologists analyze its DNA to see where it fits among known lineages. As more genomic data becomes available, phylogenies become even more detailed and accurate.
Important Vocabulary
Below is a quick reference chart of key terms used throughout this guide:
| Term | Definition / Key Feature |
| Phylogeny | The evolutionary history of a group of organisms |
| Phylogenetic Tree | A branching diagram that shows evolutionary relationships and often includes time |
| Cladogram | A diagram emphasizing shared, derived traits without necessarily indicating time |
| Node | A branch point representing a common ancestor |
| Outgroup | A species/group diverging earlier than the group of interest, used as a reference |
| Morphological Traits | Physical characteristics (shape, body parts, etc.) |
| Molecular Phylogeny | Study of evolution through gene, DNA, RNA, or protein sequence comparisons |
Practice Problem
- Scientists are studying three species of insects: R, S, and T. Below are short DNA sequences for each species (10 nucleotides each):
- Species R: A T T G C T A G A A
- Species S: A T G G C T A G A A
- Species T: A T T G G T G A A A
- Compare the sequences pairwise and count the number of differences.
- Determine which two species share the closest relationship based on these differences.
- Suggest which species could serve as an outgroup if one of them is most genetically distinct.
Step-by-Step Solution:
- Compare Species R vs. S:
- Differences observed at the 3rd position (T vs. G).
- No other differences in these 10 nucleotides.
- Total differences = 1.
- Compare Species R vs. T:
- Differences at the 5th position (C vs. G), 7th position (A vs. G), and 9th position (A vs. A) — actually the 9th is the same, so ignore that. Check carefully: the 9th nucleotide is A in both, so no difference there.
- Verify each position again carefully. Differences appear at 5th (C vs. G), 7th (A vs. G), and 8th (G vs. A).
- Total differences = 3.
- Compare Species S vs. T:
- Check each position: 1st (A vs. A), 2nd (T vs. T), 3rd (G vs. T), 4th (G vs. G), 5th (C vs. G), 6th (T vs. T), 7th (A vs. G), 8th (G vs. A), 9th (A vs. A), 10th (A vs. A).
- Differences at 3rd, 5th, 7th, and 8th positions.
- Total differences = 4.
- Based on the total differences, Species R and S share the closest relationship (only 1 difference).
- Species T has the most differences when compared with R or S, making T a strong candidate for the outgroup.
Therefore, R and S are likely on the same branch, and T branches off earlier in the evolutionary history of these insects.
Conclusion
Phylogenies are essential for anyone seeking to understand the origins and interconnections of life. These diagrams present a snapshot of how species evolve, diverge, and acquire new traits. Therefore, they deepen knowledge of biology and are fundamental in fields such as conservation, medicine, and ecology. By practicing reading and constructing phylogenetic trees or cladograms, students can excel on the AP® Biology exam and gain a clearer view of life’s vast diversity.
Keep exploring different examples, practice reading diagrams, and compare various traits. This will build a solid foundation in evolutionary biology and help you connect the dots across different topics in AP® Biology.
Sharpen Your Skills for AP® Biology
Are you preparing for the AP® Biology test? We’ve got you covered! Try our review articles designed to help you confidently tackle real-world math problems. You’ll find everything you need to succeed, from quick tips to detailed strategies. Start exploring now!
Need help preparing for your AP® Biology exam?
Albert has hundreds of AP® Biology practice questions, free response, and full-length practice tests to try out.


