Introduction
In the process of learning statistics, you will often deal with a sample rather than the entire population. This is because it is difficult and costly to study the entire population. You will often take a random sample from the population, carry out some analysis and make some inferences about the population.
Here, in particular, you would be learning about confidence intervals – what is a confidence interval, what is the process of constructing confidence intervals, the difference between one-sided confidence interval and two-sided confidence interval and most importantly, how to interpret confidence intervals?
You want to be able to make statements like – “We are 95% confidence that the population mean lies between …”. For example, suppose you want to study the heights of students in your college. It may be time-consuming for you to study the entire population, i.e. all students in your college. Hence you take out a sample of 50 students and found out the average height of those 50 students. This is the sample mean.
Constructing confidence intervals require using the sample mean (sample statistic) and margin of error. Using 90% confidence intervals, you can say that you are 90% confident that the mean height of all the students in the college will lie within the lower and upper bounds of the confidence interval.
What is a Confidence Interval?
There is always some uncertainty associated with sample statistic being used to make the estimate of the population parameter. Uncertainties may be due to random sampling error. What is a confidence interval? A confidence interval is used to describe these uncertainties. A confidence level places a lower and an upper bound within which the population parameter will lie within the given confidence level.
Example 1
The 95% confidence interval for the average weight of adults of 20-25 years of age in a country is (55 kg, 65 kg). Interpret the confidence interval.
This means that one can be 95% confident that the average weight of adults of 20-25 years of age in a country is between 55 kg and 65 kg.
This does not mean that there is 95% chance that the average weight of adults of 20-25 years of age in a country is between 55 kg and 65 kg. The population average weight of adults is not a random variable. It is a constant. Hence, interpreting confidence intervals in ‘probability’ terms is incorrect.
The confidence interval can be interpreted in another way. The confidence intervals are created to take into account, the sampling error. Suppose you use the same procedure for taking out random samples and creating confidence intervals. For some samples, the population average weight of adults of 20-25 years will lie in the confidence interval and for some it won’t. In this case, 95% confidence interval would mean that 95% of the confidence intervals will contain the true parameter, i.e. the true average weight of adults of 20-25 years of age in a country.
Constructing Confidence Intervals
For constructing the confidence interval, you will require the following:
- Sample statistic
- Margin of error
Sample statistic will be given. In order to calculate the Margin of Error, you will need to do the following:
- Know the confidence level – 90%, 95%, 99%, etc.
- Know the distribution – t, z, chi-square, etc.
- Find the sample standard error
- Know whether it is a one-sided confidence interval or two-sided confidence interval
The margin of Error = Critical value * Sample standard error.
Now, you will learn how to find critical value and standard of error.
Critical Value
For finding critical value, you need to know the distribution and the confidence level. For example, suppose you are looking at the sampling distribution of the means.
- If the population standard deviation is known, use z distribution.
- If the population standard deviation is not known, use t distribution where degrees of freedom = n-1 (n is the sample size). Note that for other sampling distributions, degrees of freedom can be different and should be calculated differently using appropriate formula.
- If the sample size is large, then use z distribution (Following the logic of Central Limit Theorem).
The confidence level will be given. If you are creating a 90% confidence interval, then confidence level is 90%, for 95% confidence interval, the confidence level is 95% and so on.
Steps for finding critical value:
Step 1: First, find alpha (the level of significance). \alpha =1 – Confidence level.
For 95% confidence level, \alpha =0.05
For 99% confidence level, \alpha =0.01
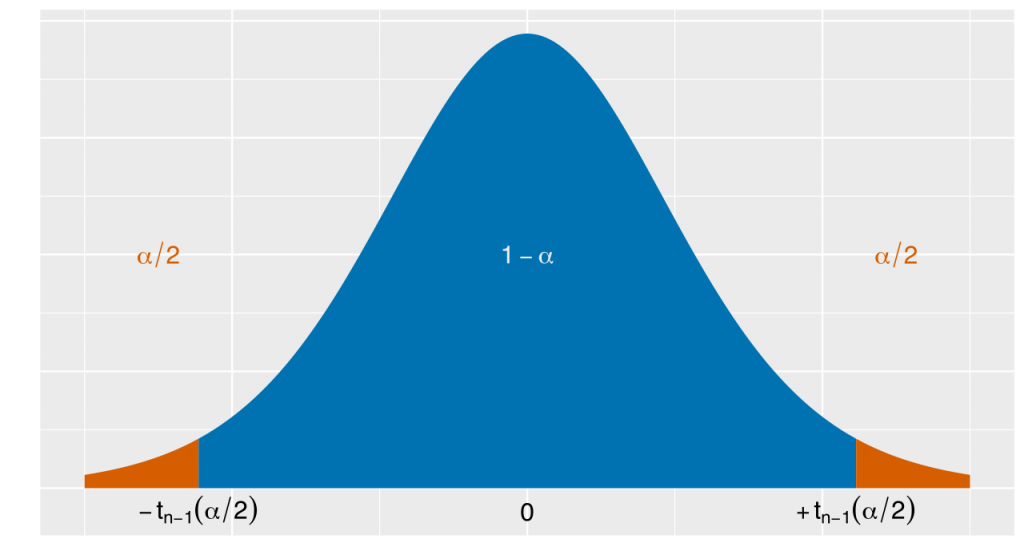
Step 2: Find the critical probability p*. Critical probability will depend on whether we are creating a one-sided confidence interval or a two-sided confidence interval.
For two-sided confidence interval, p*=1-\dfrac { \alpha }{ 2 }
For one-sided confidence interval, p*=1-\alpha
Find a z score having a cumulative probability of p*. For a t statistic, find a t score having a cumulative probability of p* and the calculated degrees of freedom. This will be the critical value. To find these critical values, you will have to use a calculator or respective statistical tables.
Sample Standard Error
Sample standard error can be calculated using population standard deviation or sample standard deviation (if population standard deviation is not known). For sampling distribution of means:
Let sample standard deviation be denoted by s, population standard deviation is denoted by \sigma and sample size be denoted by n.
\text{Sample standard error}=\dfrac { \sigma }{ \sqrt { n } }, if \sigma is known
\text{Sample standard error}=\dfrac { s }{ \sqrt { n } }, if \sigma is not known
Depending on the sampling distributions, the sample standard error can be different.
Having looked at everything that is required to create confidence intervals, you will now finally learn how to create a two-sided confidence interval and one-sided confidence interval. Post that, you will look at some examples to enhance your understanding of these concepts.
Two-sided confidence interval
Lower bound of confidence interval = Sample Statistic – Margin of Error
Upper bound of confidence interval = Sample Statistic + Margin of Error
The lower and upper bounds are the boundaries of the confidence interval which describes the uncertainties associated with the sampling method.
The two-sided confidence interval is given as:
Sample Statistic – Critical value * Sample standard error, Sample Statistic + Critical value * Sample standard error
One-sided confidence interval
You may create a lower interval or an upper interval
Lower interval
Lower bound of confidence interval = -\infty
Upper bound of confidence interval = Sample Statistic + Margin of Error
The lower one-sided confidence interval is given as:
-\infty, Sample Statistic + Critical value * Sample standard error
Upper interval
Lower bound of confidence interval = Sample Statistic – Margin of Error
Upper bound of confidence interval = +\infty.
The lower one-sided confidence interval is given as:
Sample Statistic – Critical value * Sample standard error, +\infty
You have learned everything on how to calculate the confidence intervals. Summarizing the steps to create confidence interval:
Step 1: Identify the sample statistic.
Step 2: Identify the confidence level.
Step 3: Identify the distribution – t, z, etc. and find the critical value based on whether the need is a one-sided confidence interval or a two-sided confidence interval.
Step 4: Find the sample standard error.
Step 5: Create the confidence interval using the sample statistic, critical value, and sample standard error.
You will follow these five steps whenever you have to create confidence interval. Look at some examples below.
Example 1
25 students in their final year were selected at random from a high school for a survey. Among the survey participants, it was found that the average GPA (Grade Point Average) was 2.9 and the standard deviation of GPA was 0.5. Find the 95% confidence interval for the population mean GPA and give the correct interpretation of the confidence interval.
Step 1: Identify the sample statistic.
Since you need to find the confidence interval for the population mean, the sample statistic is the sample mean which is the average GPA = 2.9
Step 2: Identify the confidence level.
Since you have to create 95% confidence interval, confidence level = 95%. Also, you have to create a two-sided confidence interval here.
Step 3: Identify the distribution – t, z, etc. and find the critical value based on whether the need is a one-sided confidence interval or a two-sided confidence interval.
Since population standard deviation is not known and the sample size is small, use a t distribution.
Degrees of freedom = n – 1 = 25 – 1 = 24
α = 1 – Confidence level = 1 – 0.95 = 0.05
Let the critical probability be p*.
For two-sided confidence interval,
p*=1-\dfrac { \alpha }{ 2 } =1-\dfrac { 0.05 }{ 2 } =0.975
The critical t value for cumulative probability of 0.975 and 24 degrees of freedom is 2.064
Step 4: Find the sample standard error.
\text{Sample standard error}=\dfrac { s }{ \sqrt { n } } =\dfrac { 0.5 }{ \sqrt { 25 } }=0.1
Step 5: Create the confidence interval using the sample statistic, critical value, and sample standard error.
Confidence interval is:
Sample Statistic – Critical value * Sample standard error, Sample Statistic + Critical value * Sample standard error
2.9 – 2.064 * 0.1, 2.9 + 2.064 * 0.1
2.694, 3.106
The 95% confidence interval for the population mean GPA is (2.694, 3.106). This means that you can be 95% confident that the population average GPA will lie between 2.694 and 3.106. In other words, if you take out several samples from the population randomly and of the same size and create confidence intervals, then 95% of the confidence intervals will contain the true parameter, i.e. the true population mean GPA.
Example 2
400 students in Princeton University are randomly selected for a survey which is aimed at finding out the average time students spend in the library in a day. Among the survey participants, it was found that the average time spent in the university library was 45 minutes and the standard deviation was 10 minutes. Find the 99% confidence interval for the population mean time spent in the university library and give the correct interpretation of the confidence interval.
Step 1: Identify the sample statistic.
Since you need to find the confidence interval for the population mean, the sample statistic is the sample mean which is the mean time spent in the university library = 45 minutes
Step 2: Identify the confidence level.
Since you have to create 99% confidence interval, confidence level = 99%. Also, you have to create a two-sided confidence interval here.
Step 3: Identify the distribution – t, z, etc. and find the critical value based on whether the need is a one-sided confidence interval or a two-sided confidence interval.
The population standard deviation is not known but the sample size is large. Therefore, use a z (standard normal) distribution.
α = 1 – Confidence level = 1 – 0.99 = 0.01
Let the critical probability be p*.
For two-sided confidence interval,
p*=1-\dfrac { \alpha }{ 2 } =1-\dfrac { 0.01 }{ 2 } =0.995
The critical z value for cumulative probability of 0.995 (as found from the z tables) is 2.576
Step 4: Find the sample standard error.
\text{Sample standard error}=\dfrac { s }{ \sqrt { n } } =\dfrac { 10 }{ \sqrt { 400 } } =0.5
Step 5: Create the confidence interval using the sample statistic, critical value, and sample standard error.
Confidence interval is:
Sample Statistic – Critical value * Sample standard error, Sample Statistic + Critical value * Sample standard error
45 – 2.576 * 0.5, 45 + 2.576 * 0.5
43.712, 46.288
The 99% confidence interval for the population mean time spent in the library is (43.712, 46.288). This means that you can be 99% confident that the population mean time spent in the library will lie between 43.712 minutes and 46.288 minutes. In other words, if you take out several samples from the population randomly and of the same size and create confidence intervals, then 99% of the confidence intervals will contain the true parameter, i.e. the true population mean time spent in the university library.
Note that, if you create 95% confidence interval for the same problem, the 95% confidence interval will be narrower than the 99% confidence interval. As the confidence level increases, the size/width of the confidence interval increases.
Conclusion
Confidence intervals are an important concept in statistics. This is because it is difficult to study the entire population and the sampling is not free from sampling errors. Hence, it is always better to report a confidence interval for a population parameter rather than just reporting a single value. In this article, you learned about what is a confidence interval, its interpretation and the way of constructing confidence intervals. This article has equipped you with confidence intervals which will be used extensively in statistics and econometrics.
Let’s put everything into practice. Try this Statistics practice question:

Looking for more Statistics practice?
You can find thousands of practice questions on Albert.io. Albert.io lets you customize your learning experience to target practice where you need the most help. We’ll give you challenging practice questions to help you achieve mastery in Statistics.
Start practicing here.
Are you a teacher or administrator interested in boosting Statistics student outcomes?
Learn more about our school licenses here.


