
Now that we have a handle on solving systems of equations algebraically and graphically, let’s try graphing systems of inequalities to find their solutions.
Imagine that you are in charge of baking cupcakes for a party. You are told that the following equation can represent the number of party guests.
y=7
In this case, the answer is clear. We need to bake enough cupcakes for 7 people.
Instead, what if the following inequality represented the number of guests attending the party?
y \geq 7
How can we figure out how many cupcakes to bake when there could be 7, 8, 33, or even more guests all wanting cupcakes? Our dilemma just got more interesting.
In math, inequalities also tend to make things more… interesting. This post will overview the process for solving systems of inequalities by graphing.
What are Systems of Inequalities?
First, let’s review the basics. The linear equation below represents a single line on the coordinate plane.
y=x
The solutions to this equation will be all points on that line. Now, we can pair that equation with another equation to create a system of equations.
y=x
y=-x
The solution to the system of equations will be the coordinates of any points which make both statements true.
But what about a system of inequalities? In many ways, systems of equations and inequalities are similar.
Inequalities are statements that include a <, >, \leq, or \geq sign instead of an = sign. Linear inequalities are statements which include two variables, usually x and y. For example, consider the system of inequalities below.
y>x
y< -x
We can check if a point is a solution to a system of inequalities by substituting the coordinates into the inequalities. When thinking about both linear equations and linear inequalities, the origin often serves as a reference point. So, let’s test the point ({\color{red}{0}},{\color{blue}{0}}).
| {\color{blue}{0}}>{\color{red}{0}} 0>0 | {\color{blue}{0}}< -{\color{red}{0}} 0< 0 |
Zero is neither less than nor greater than zero, so both of these inequalities are not true. ({\color{red}{0}},{\color{blue}{0}}) is not a solution to this system.
However, if our system used the \geq and \leq symbols, we might notice something different.
| y\geq x {\color{blue}{0}}\geq{\color{red}{0}} 0\geq0 | y\leq -x {\color{blue}{0}}\leq -{\color{red}{0}} 0\leq 0 |
These are true statements, so the point (0,0) is a solution to our new system.
However, testing points is not an efficient way to find all solutions to a system of inequalities. Let’s learn how to graph a system of inequalities to find the solutions.
How to Solve System of Inequalities by Graphing
We will often solve systems of linear inequalities by graphing. Graphing systems of inequalities follows the same process as graphing linear inequalities.
When we graph a linear inequality, we shade the region that makes up the solution. But how we plot the line and where we shade depends on the symbol of inequality used.
Suppose the inequality involves either a < or > sign. In that case, the boundary line will be drawn as a dotted line to signify that points on the line are not included in the solution. For example, consider the graph of y > x below.

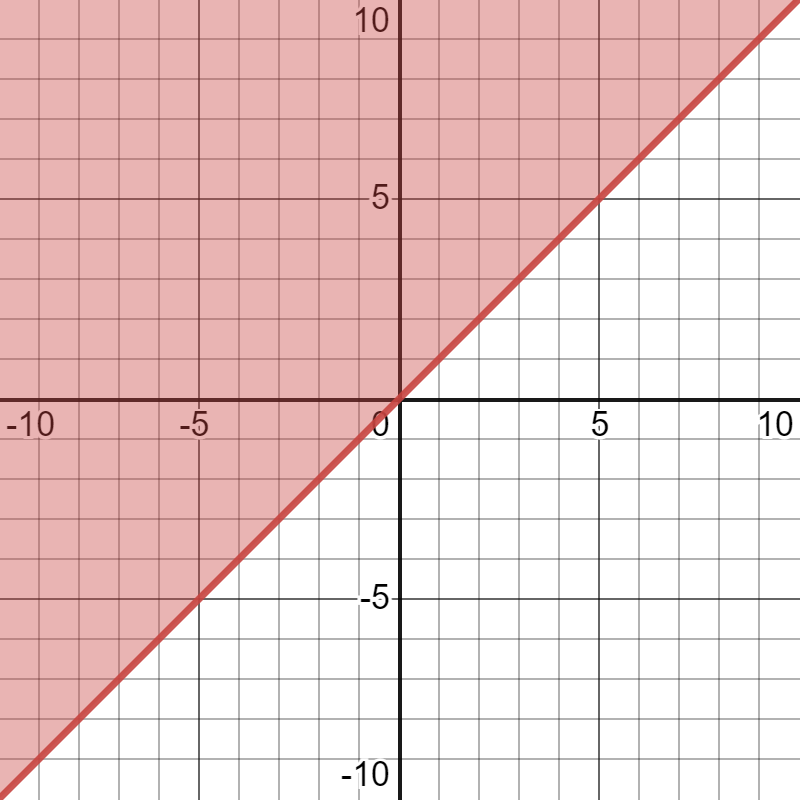
On the other hand, if the inequality uses a \leq or \geq sign, then the boundary line will be drawn as a solid line to signify that points on the line are included in the solution. For instance, look at the graph of y \geq x below.
How to Graph a System of Inequalities
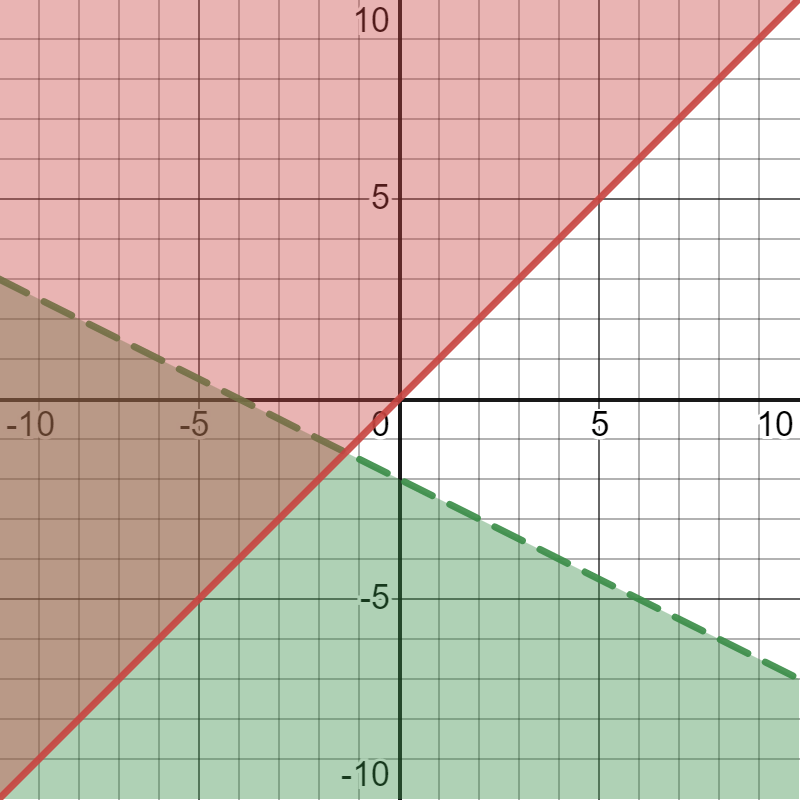
Let’s review graphing systems of inequalities using the system below.
y \geq x
y < -\frac{1}{2}x-2
First, notice that these inequalities have y isolated. So, they follow the slope-intercept form of a linear equation, y=mx+b, where m is the slope and b is the y-intercept. We can start graphing these inequalities just like we would graph an equation.
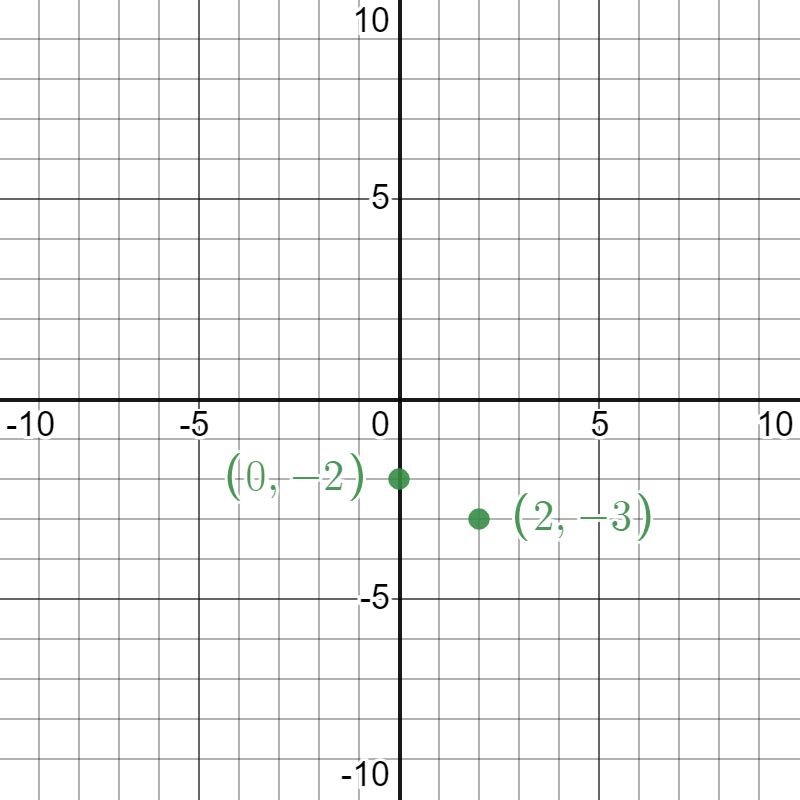
To graph y = -\frac{1}{2}x-2, first note that the y-intercept (b) equals -2. Therefore, we can plot a point at (0,-2). The slope (m) equals -\frac{1}{2}. From our first point, we move down 1 unit and run right 2 units to plot a second point at (2,-3).
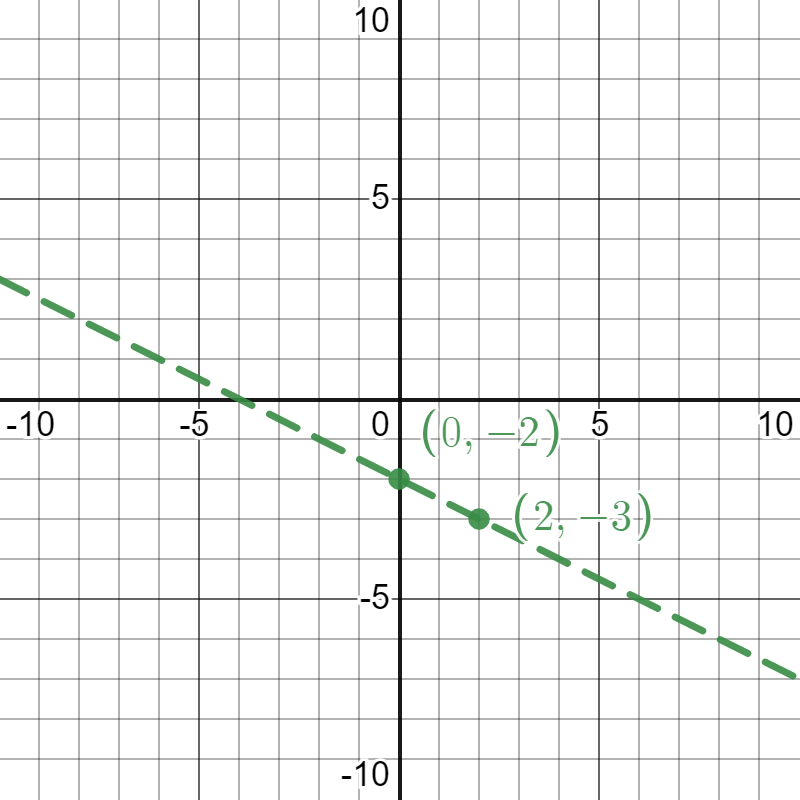
Next, we want to connect the points to complete the line. However, since we are graphing an inequality, we need to think about whether we will connect the points with a solid or dotted line. Since we have a < sign rather than a \leq sign in our inequality, our line will be dotted.
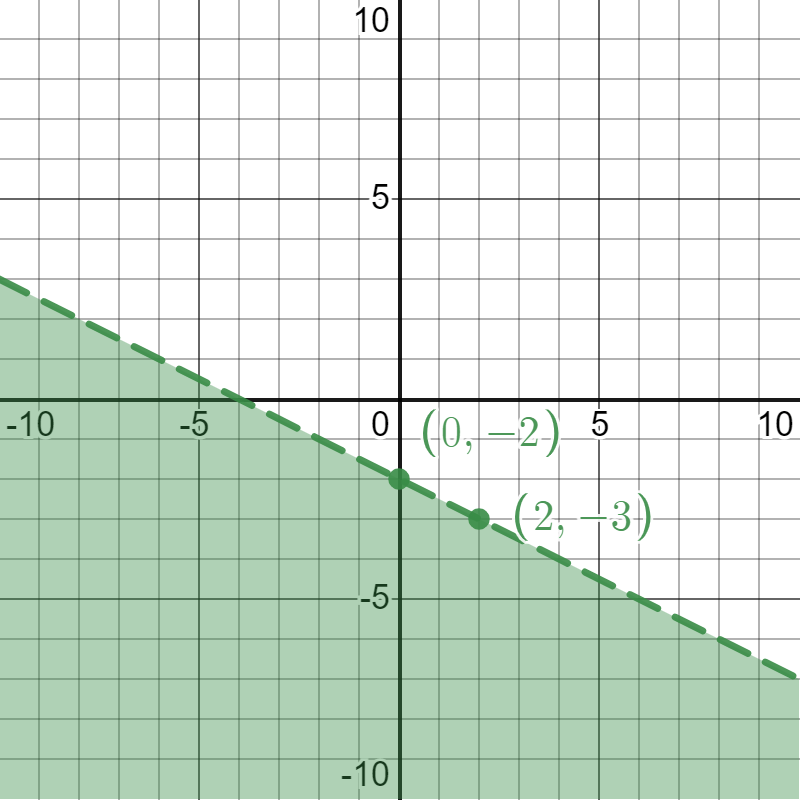
Finally, we must decide which side of the boundary line will be shaded. Since the inequality starts with y <, we should shade below the line.
To confirm, we can substitute a point into the inequality and see whether it’s included in the solution. Let’s test the point ({\color{red}{0}},{\color{blue}{0}}).
y < -\frac{1}{2}x-2
{\color{blue}{0}} < -\frac{1}{2}({\color{red}{0}})-2
0 < -2
Just as we expected, this inequality is not true. This confirms the origin is not included in the solution, so we should shade the side of the line that excludes the origin.
To solve the system of inequalities, we can repeat this graphing process for the other inequality, y \geq x. The solution to the system is the area where the shaded portions of the graphs overlap.
All points in the area where the shaded regions overlap are solutions to both inequalities in the system. To confirm, we can pick a point from this region and substitute it into each inequality. Let’s try the point ({\color{red}{-5}},{\color{blue}{-1}}).
| y \geq x {\color{blue}{-1}} \geq {\color{red}{-5}} True! | y < -\frac{1}{2}x-2 {\color{blue}{-1}} < -\frac{1}{2}({\color{red}{-5}})-2 -1 < \frac{1}{2} True! |
Steps for Solving Systems of Inequalities
To sum it up, here are the steps to graphing systems of inequalities:
- Plot two points for the first inequality using the y-intercept and slope, just like when graphing a linear equation.
- Connect the points with either a dotted line or a solid line, depending on the inequality symbol.
- Shade the area above or below the line depending on the inequality sign.
- Repeat steps 1, 2, and 3 for each additional inequality and identify any areas of overlap in the shading as the solution to the system of inequalities.
- Check by selecting coordinates from the solution area and substituting them into each inequality to ensure that the resulting statements are true.
How to Write a System of Inequalities from a Graph
Suppose we are given a graph and asked which system of inequalities is represented by the graph. Systems of inequalities graphs can help us write the systems themselves. Let’s try a challenging example.
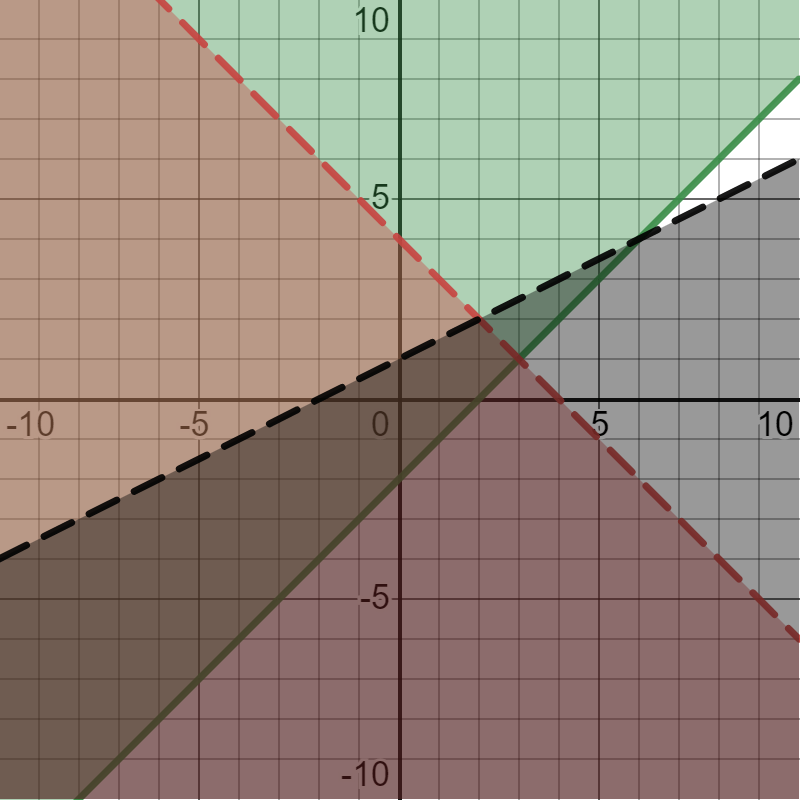
Here we have three lines representing a system of three inequalities. The solution is the darkest of the shaded regions. We need to write equations for all three lines and then express those as inequalities.
Let’s begin with the downward sloping line.
To write a linear equation from a graph, first identify the y-intercept, the point where the line crosses the y-axis. In this case, that’s (0,4). Next, identify a second point to the right of the y-intercept. Let’s choose (1,3). From (0,4) to (1,3) is 1 unit down and 1 unit right, meaning the slope must be -\frac{1}{1} or -1.
We can write an equation for this line in slope-intercept form as y=-x+4.
However, we need to express this as an inequality. Notice that the line is dotted, meaning points on the line are not included in the solution. Therefore, the inequality symbol will be either < or >. Second, the shading is below the line, suggesting that the sign should be <. So, our inequality is:
y<-x+4
Now, we repeat the process for the upward sloping dotted line, which we determine to be:
y<\frac{1}{2}x+1
Lastly, we repeat the process one more time for the solid line with the positive slope, which we determine to be:
y \geq x-2
Finally, let’s check what we’ve come up with using substitution to make sure we are correct. The graph shows that the origin, (0,0), is in the triple-shaded area and thus is a solution to the system. Substituting the coordinates of the origin into each inequality should result in three true statements.
| y< -x+4 {\color{blue}{0}}< -({\color{red}{0}})+4 0<4 True! | y<\frac{1}{2}x+1 {\color{blue}{0}}<\frac{1}{2}({\color{red}{0}})+1 0<1 True! | y \geq x-2 {\color{blue}{0}} \geq {\color{red}{0}}-2 0 \geq -2 True! |
How to Solve a System of Inequalities without Graphing
While we will usually be graphing systems of inequalities, what if we needed to solve a system of inequalities without graphing? Instead of a graph, we could also use a table of values to help us identify the solution. Let’s see how this works with the following system of inequalities.
x-y \geq 1
4x+3y \leq 22
This method works in situations where both x and y must be whole numbers. First, we’ll create a table of values that includes all the whole numbers that make the second inequality true.
| x | y |
| 0 | 0,1,2,3,4,5,6,7 |
| 1 | 0,1,2,3,4,5,6 |
| 2 | 0,1,2,3,4 |
| 3 | 0,1,2,3 |
| 4 | 0,1,2 |
Now we will highlight any pairs of (x,y) values which also satisfy the first inequality, x-y \geq 1.
| x | y |
| 0 | 0,1,2,3,4,5,6,7 |
| 1 | 0, 1,2,3,4,5,6 |
| 2 | 0,1, 2,3,4 |
| 3 | 0,1,2, 3 |
| 4 | 0,1,2 |
The highlighted pairs, (1,0), (2,0), (2,1), (3,0), (3,1), (3,2), (4,0), (4,1), and (4,2) are the solutions to the system of inequalities.
For more information about using tables to solve systems of inequalities, check out this video.
Graphing Systems of Inequalities: Keys to Remember
- Systems of inequalities are similar to systems of linear equations.
- We can graph systems of inequalities to find their solution.
- The solution to a system of inequalities is where the shaded regions of each inequality overlap.
- Inequalities using the greater than or equal to sign or the less than or equal to sign are graphed with solid lines, while inequalities using the greater than sign or less than sign have dotted lines.
- When inequalities are graphed, the area above or below the boundary line is the solution to the inequality.
- We can check solutions algebraically using substitution.
- We can write systems of inequalities from a graph of the inequalities and the solution area.
- The solution to a system of inequalities can also be found using a table of values.


