What We Review
Introduction
In high school, no matter the subject, you’ll come across lots of nonfiction readings. These aren’t just your typical texts; they often include charts, graphs, and numbers. It might be tempting to skip over these parts and focus only on the words, but don’t! This visual and number stuff is just as important as the main text. Understanding these elements really helps you get the full picture of what you’re reading.
Understanding Visual and Quantitative Information
Visual and quantitative information comes in various forms. You typically find it in nonfiction texts, particularly science, math, or social studies textbooks. Often, this information is used to help explain a challenging topic, but sometimes, it is used to defend a claim made in the text.
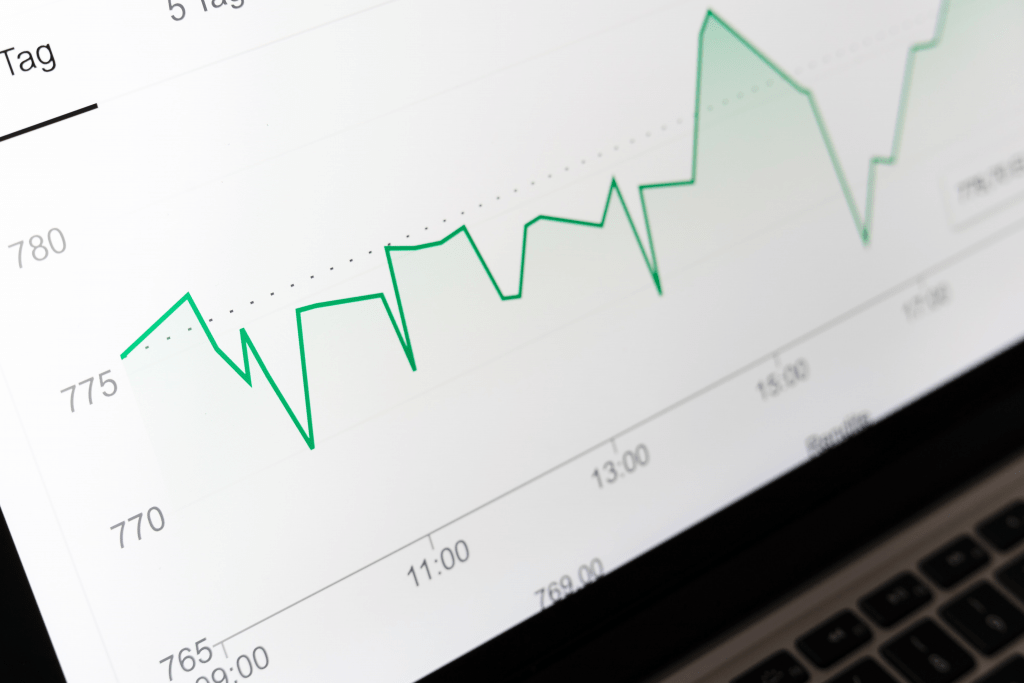
Visual information can be graphs, charts, diagrams, maps, timelines, or photographs. A science textbook, for example, may include a diagram of the human body to accompany a section of body text explaining the circulatory system. Alternatively, a history textbook may include a timeline of significant historical events to mark the progressive fall of Rome.

Quantitative information includes statistics, study results, census data, percentages, and other numerical data. You can find it in various nonfiction texts. Sometimes, these numbers support the author’s claims. For example, a medical journal arguing for the benefits of regular exercise may quote that 85% of individuals over 60 who exercised for at least 30 minutes a day had fewer health issues compared to their peers who did not exercise regularly.
When used correctly, visual and quantitative information can enhance a nonfiction text and bring greater understanding to the reader. But if they’re off-topic, low quality, or outdated, they can make the reading confusing or even give you the wrong idea.
Strategies for Analyzing Visual and Quantitative Information
You can employ several effective strategies when analyzing visual and quantitative texts. The first of these is close reading. Close reading allows you to closely interpret a text across multiple readings, each with a different focus and purpose. This is effective for understanding a challenging text when implemented correctly.
Close reading has four main steps. First, you skim the text to get the gist of it. Then, you read it more carefully to pick up on the basic ideas. The third time, you go even deeper to understand the text better. Finally, you think about how your reading connects to the real world.
As you do this, pay attention to patterns or trends in the visuals and data. This can help you match up what you’re seeing with what you’re reading, which makes everything clearer and helps you decide if the information is trustworthy. If the images or numbers don’t match what the text is saying, something might be off.
When analyzing visual and quantitative information, remember that this information is integral to the meaning of the chapter, section, or article as a whole. Avoid singling out a particular image or statistic. Rather, look to understand the relevance of this visual or quantitative text in the context of the whole body of text. This will give you a much better understanding of what you’re learning.
Common Challenges and Pitfalls to Avoid
When analyzing visual and quantitative information, there are a couple of traps you might fall into. One big mistake is just ignoring them or misinterpreting them because you think the words are all that matter. But remember, using everything the text offers, including pictures and numbers, can really deepen your understanding.
Nonfiction readings are often broken into sections, which is great for a strategy called chunking. This means you focus on one section at a time. After you read a bit, try to put what it’s saying in your own words, including what the pictures and numbers are showing. This helps make sure you’re catching all the important bits.
By breaking it down this way, you get a good grip on the smaller parts first. Then, you can start to see the big picture of what the whole chapter or article is about. This method really helps in making sure you don’t miss out on what the author is trying to tell you.
Conclusion
Visual and quantitative information is equally as important as the main body of text and is of immense value when comprehending nonfiction texts.
It can be helpful to ensure that nonfiction is on your reading list. This way, you’ll be ready and confident when encountering these kinds of texts in other subjects. The more you practice, the better you’ll get at making sense of all the information they throw at you!
Practice Makes Perfect
In addition to the recommended activities above, Albert provides a wide range of texts for students to analyze and interpret. For emerging readers, check out our Short Readings course, which uses short passages to reinforce fundamental reading skills. Readers at all ability levels may enjoy our Leveled Readings course, which offers Lexile® leveled passages focused on a unifying essential question that keeps all students on the same page regardless of reading level. Learn more about the Lexile Framework here!
For authentic practice, check out our Essential Readings in Literature course. This course provides an overview of the core texts that American students often read in English class. Each text is broken down by skill, ensuring that students approach their reading from every angle.
With our easy-to-use interface and informative feedback, Albert.io is the perfect tool for reinforcing close reading skills and helping students develop a deeper understanding of the texts they encounter.


