
Population ecology examines how groups of organisms change over time, interact with one another, and adjust to their environment. Therefore, it offers insight into conservation, urban development, and agriculture strategies. Understanding these concepts helps clarify when populations may expand, stabilize, or decline.
Below is a comprehensive guide to population ecology for high school students. The material is divided into clear sections with simple explanations and relevant examples. Practice problems are also included to reinforce learning.
What We Review
Introduction to Population Ecology
To define population in biology, imagine a group of the same species living in a specific area at the same time. These individuals must be able to interact and potentially reproduce. For instance, all the salmon in a single river segment form a population. Biologists study population size (number of individuals) and population density (number of individuals per unit area). By tracking these values, scientists can see how population traits change over time.
Many important research questions focus on birth rates, death rates, and how environmental changes affect species. Population ecology also helps in predicting outbreaks or declines that might impact ecosystems. Moreover, it aids conservation efforts by pinpointing where and how populations need protection.
Population growth dynamics describe how populations change in size. Sometimes, populations grow rapidly if resources are abundant. Other times, they slow down if resources become limited. Therefore, patterns like exponential growth and logistic growth are vital for understanding fluctuations in population size.
Key Factors Influencing Population Growth
A. Birth and Death Rates
Birth and death rates are often the most direct factors influencing population numbers. These rates can shift for various reasons:
- Reproductive strategies: Species may have many offspring at once (like frogs) or only a few (like elephants).
- Life expectancy: Longer lifespans typically allow individuals more chances to reproduce.
- Environmental conditions: Disease, food availability, and competition can affect survival.
Example: Analyzing Frog Population Growth
Frogs lay numerous eggs in a pond. Suppose 200 eggs hatch into tadpoles, but only 50 survive to become adult frogs. After reaching adulthood, each frog lays hundreds of eggs. This high birth rate can balance high death rates.
Practice Problem:
Given that a single frog lays 400 eggs, and 10% survive to adulthood, how many adult frogs are expected per laying cycle?
Step-by-Step Solution:
- Calculate 10% of 400: 10% \times 400 = 40.
- Therefore, about 40 froglets reach adulthood each time one frog lays 400 eggs.
B. Immigration and Emigration
- Immigration is when new individuals enter a population.
- Emigration is when individuals leave a population.
- These movements can greatly influence local population size, especially in mobile species like birds or large mammals.
Example: The Effect of Migration on Bird Populations
Imagine a flock of migrating geese. If 100 new geese join each year (immigration) and 50 leave (emigration), the population experiences a net increase of 50 individuals annually. However, this gain or loss must be considered alongside birth and death rates for a complete understanding.
Practice Problem:
If a local seagull population has a birth rate of 100 new chicks per year and a death rate of 30 birds per year, how will the population change if an additional 20 birds immigrate and 10 birds emigrate annually?
Step-by-Step Solution:
- Calculate the net gain from births and deaths: 100 - 30 = 70.
- Calculate the net gain from immigration and emigration: 20 - 10 = 10.
- Total annual increase: 70 + 10 = 80 birds per year.
C. Environmental Factors
Environmental factors such as resource availability and habitat stability can influence population growth. When resources are plentiful, populations may expand quickly. However, if resources decrease, populations tend to shrink.
- Availability of Resources: Food, water, and shelter are essential.
- Habitat Stability: Suitable conditions, like a consistent climate, favor population growth.
Example: The Role of Weather in Plant Growth
Drought can reduce plant populations by limiting water availability. However, a rainy season often causes a plant population to rebound. Climate patterns can have drastic impacts on how quickly plants grow or reproduce.
Practice Problem:
A field of wildflowers can produce 500 seeds in the rainy season but only 200 seeds in the dry season. If two rainy seasons occur, followed by one dry season, how many seeds will be produced in total?
Step-by-Step Solution:
- Calculate total seeds from the rainy seasons: 2 \times 500 = 1000.
- Calculate seeds from the dry season: 200.
- Sum the amounts: 1000 + 200 = 1200 seeds overall.
Population Growth Models
A. Exponential Growth
1. Explanation of the Concept
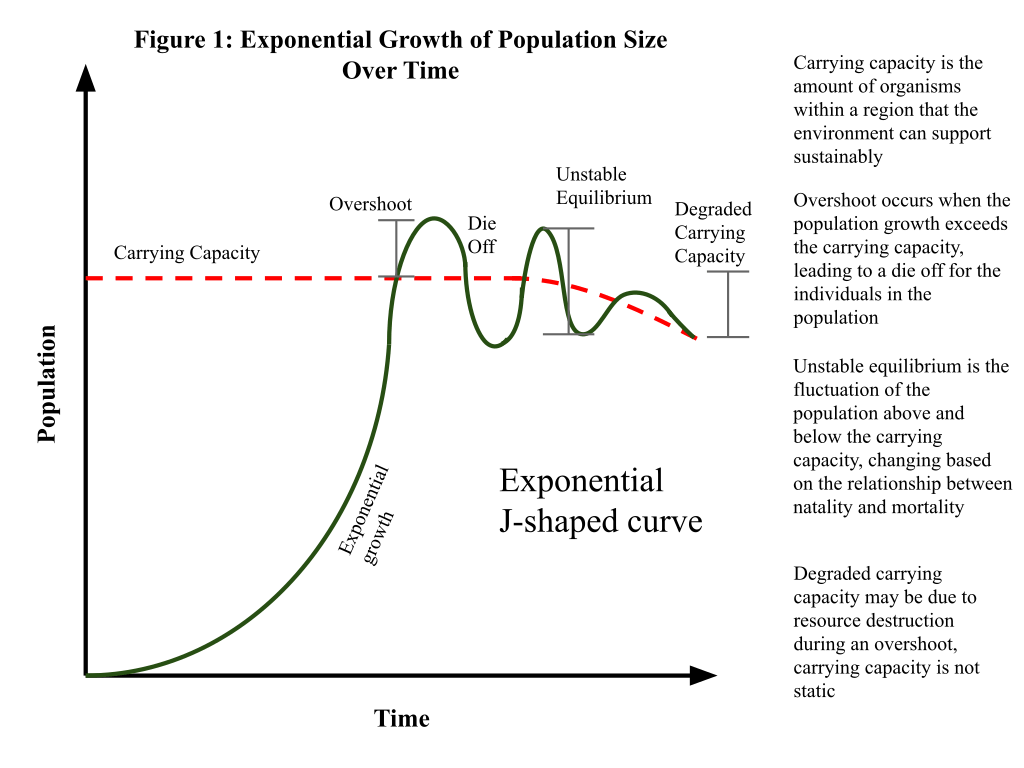
Exponential population growth occurs when resources are unlimited and individuals reproduce at a constant rate. Therefore, the population size can increase very quickly.
2. Characteristics and Graphs
- Growth rate stays the same over time.
- The curve on a population graph is J-shaped.
- This pattern is more common in ideal conditions without constraints.
3. Example Calculation: Projecting Population Growth
The exponential growth equation is:
N(t) = N_{0} , e^{r t}Where:
- N(t) = population size at time t
- N_{0} = initial population size
- r = intrinsic growth rate (a constant)
- e = mathematical constant (approximately 2.718)
Practice Problem:
A population of 50 rabbits doubles every year without limitation. Using exponential growth, how many rabbits will there be after 3 years? Assume an intrinsic growth rate that doubles the population annually. Therefore, r can be estimated in a simplified manner by letting the population size double each time unit.
Step-by-Step Solution:
- Recognize that doubling each year implies the population size is multiplied by 2 each year.
- After 1 year: 50 \times 2 = 100.
- After 2 years: 100 \times 2 = 200.
- After 3 years: 200 \times 2 = 400.
- Thus, the population will reach 400 rabbits after 3 years.
B. Logistic Growth
1. Definition and Graphical Representation
Logistic growth occurs when resources are limited, causing population growth to slow as it approaches a maximum limit called carrying capacity. The growth curve forms an S shape.
2. Carrying Capacity
Carrying capacity (K) is the maximum number of individuals that an environment can support. When a population overshoots K, environmental resistance like disease or lack of food may lower the population.
3. Example: Modeling Bacterial Growth in a Petri Dish
Bacteria often start with rapid, exponential growth. However, nutrients in a Petri dish are finite. As resources deplete, growth slows and eventually stabilizes at a certain number of bacteria.
Practice Problem:
A Petri dish starts with 100 bacteria. It can support up to 1000 bacteria. After the first day, the population grows quickly. By day 4, the population size is approaching carrying capacity. Estimate how close the population is to 1000 if the count is 950 on day 5.
Step-by-Step Solution:
- Assess that the population is 50 away from the carrying capacity (1000 – 950 = 50).
- Because resources are nearly used up, further growth will slow.
- The remaining growth room is about 5% of the carrying capacity (50 out of 1000).
Interactions Within Populations
A. Density-Dependent Factors
Density-dependent factors increase or decrease in effect based on population density. Therefore, these factors often regulate population size around a certain level.
- Competition: Occurs when organisms vie for the same resources.
- Predation: One species preys upon another.
- Example: Effects of Predator-Prey Relationships
- A rise in rabbit numbers often leads to an increase in foxes that feed on them.
- However, as fox numbers grow, rabbit numbers may decline, leading to fewer food sources. This can cause the fox population to drop.
Practice Problem:
If rabbit numbers grow too large, foxes increase. After the fox population grows, rabbit numbers fall from 500 to 200. By how many did the rabbit population decrease?
Step-by-Step Solution:
- Initial rabbit count is 500.
- New rabbit count is 200.
- Decrease = 500 - 200 = 300.
B. Density-Independent Factors
Density-independent factors affect a population regardless of its size or density.
- Natural Disasters: Floods, hurricanes, and fires can reduce populations suddenly.
- Human Activity: Pollution, deforestation, and urban expansion can disrupt habitats.
- Example: Impact of Deforestation on Local Wildlife
- When trees are cut down, many species lose shelter.
- Even large populations can collapse because the key resource they need is gone.
Practice Problem:
A forest supports around 300 squirrels. After a severe storm, 40% of the forest is destroyed. Assuming the squirrels depend solely on the remaining habitat, estimate the new potential carrying capacity if the habitat can now only support 60% of its original population.
Step-by-Step Solution:
- Original carrying capacity = 300 squirrels.
- Remaining portion suitable for squirrel habitat = 60%.
- New capacity = 300 \times 0.60 = 180 squirrels.
Practical Applications of Population Ecology
A. Conservation Efforts
Conservation programs use population ecology to protect endangered species and restore ecosystems. Tracking birth rates, death rates, and migration allows wildlife managers to see which habitats need restoration.
B. Urban Planning
City planners use population data to decide where new housing, roads, or parks might be placed. Knowing how populations might grow or shrink prevents overcrowding and supports sustainable development.
C. Agriculture and Resource Management
Farmers look at the best strategies for crop rotation, pest control, and livestock management. Overusing resources can lead to collapsed yields, so understanding population dynamics is crucial to ensure stable harvests.
Quick Reference Chart: Vocabulary and Definitions
| Term | Definition |
| Population | A group of individuals of the same species living in the same area, at the same time. |
| Population Density | Number of individuals per unit area or volume. |
| Birth Rate | Number of new individuals born in a given time frame. |
| Death Rate | Number of individuals dying in a given time frame. |
| Immigration | Movement of individuals into a population. |
| Emigration | Movement of individuals out of a population. |
| Exponential Growth | Rapid population increase under ideal, unlimited conditions. |
| Logistic Growth | Growth that slows as it reaches carrying capacity, forming an S-shaped curve. |
| Carrying Capacity (K) | Maximum number of individuals an environment can support sustainably. |
| Density-Dependent | Factors whose effects intensify as the population density increases. |
| Density-Independent | Factors that affect populations similarly, regardless of density (e.g., natural disasters). |
| Exponential Population Growth | Another expression for continuous, fast growth without environmental limits. |
Conclusion
Population ecology connects the dots between biology, environment, and human activities. Because populations behave differently depending on births, deaths, migration, and other factors, scientists must consider many variables. By using population models like exponential and logistic growth, researchers can predict trends and devise strategies for conservation and resource management.
For further reading, consider exploring textbooks on ecology or visiting reputable websites like the National Park Service for real-life population studies. With these basics, it becomes easier to appreciate how delicate and fascinating population dynamics truly are.
Sharpen Your Skills for AP® Biology
Are you preparing for the AP® Biology test? We’ve got you covered! Try our review articles designed to help you confidently tackle real-world math problems. You’ll find everything you need to succeed, from quick tips to detailed strategies. Start exploring now!
Need help preparing for your AP® Biology exam?
Albert has hundreds of AP® Biology practice questions, free response, and full-length practice tests to try out.


