
What We Review
Understanding Quantitative Evidence: A Guide to Reading Charts and Graphs for SAT® Reading and Writing
Interpreting graphs and charts can seem intimidating at first. However, this skill is essential for the SAT® Reading and Writing section and for real-life situations. Graphs and charts provide numerical information, known as quantitative evidence. They illustrate data in a way that text alone cannot. Therefore, learning how to read them accurately can help you answer questions more confidently and efficiently.
Below is a friendly and step-by-step guide to reading some of the most common types of charts and graphs you will encounter: bar graphs, pie charts, and line graphs. This article will also show you how to connect visual data to written passages for deeper understanding.
Understanding Quantitative Evidence
Quantitative evidence refers to information expressed in numbers. For example, test scores, poll results, and survey statistics are all forms of quantitative evidence. This type of information is powerful because it often reveals trends or comparisons that can strengthen an argument or illustrate a concept.
- In academics, quantitative evidence is often used to support hypotheses in reports and papers.
- In the real world, it appears in news articles, financial statements, and public health data.
Exam questions about graphs and charts may ask you to interpret data, identify trends, or connect findings to an accompanying text. Because of this, it is important to develop strong graph-reading and chart-reading skills.
Types of Charts and Graphs
Charts and graphs appear in many forms. However, the SAT® Reading and Writing Test usually features three common types:
- Bar Graphs
- Pie Charts
- Line Graphs
Each type provides different insights. Below, you will find explanations and examples that will help you become familiar with these visual aids.

Bar Graphs
A bar graph uses horizontal or vertical bars to show comparisons among different categories. The length of each bar represents a specific quantity. This format easily shows which category is largest, smallest, or somewhere in between.
Example of Bar Graph
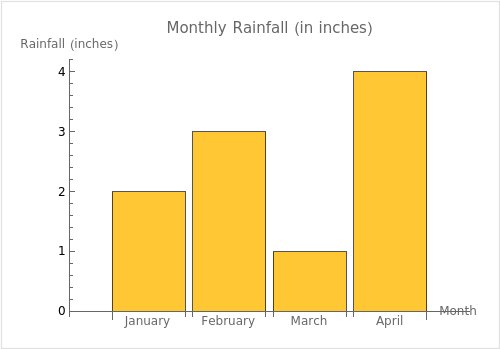
Look at the bar graph above titled “Monthly Rainfall (in inches).” It shows four months: January, February, March, and April.
- January: 2 inches of rain
- February: 3 inches of rain
- March: 1 inch of rain
- April: 4 inches of rain
Step-by-Step Interpretation
- Read the title: “Monthly Rainfall (in inches).”
- Identify the x-axis or categories: January, February, March, and April.
- Identify the y-axis label: Rainfall in inches.
- Compare the bar heights:
- January’s bar is 2 inches high.
- February’s bar is 3 inches high.
- March’s bar is 1 inch high.
- April’s bar is 4 inches high.
- Conclude that April has the highest rainfall, and March has the lowest.
Practice Problem
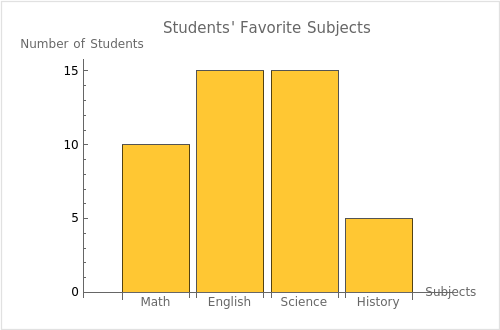
Look at the bar graph labeled “Students’ Favorite Subjects.” The subjects along the x-axis are Math, English, Science, and History, and the y-axis represents the number of students. The bars show:
- Math: 10 students
- English: 15 students
- Science: 15 students
- History: 5 students
Question: Which subject is least popular, and how many students selected it?
Solution Steps:
- Read the title: “Students’ Favorite Subjects.”
- Check the x-axis categories: Math, English, Science, and History.
- Check the heights of the bars and the y-axis scale.
- Compare the values: Math (10), English (15), Science (15), History (5).
- Observe that History has the lowest number, with 5 students selecting it.
- Answer: History is the least popular and 5 students selected it.
Pie Charts
A pie chart is a circular chart divided into slices. Each slice represents part of a whole. The entire circle equals 100%, and each slice’s size indicates the percentage of that part.
Example of Pie Chart
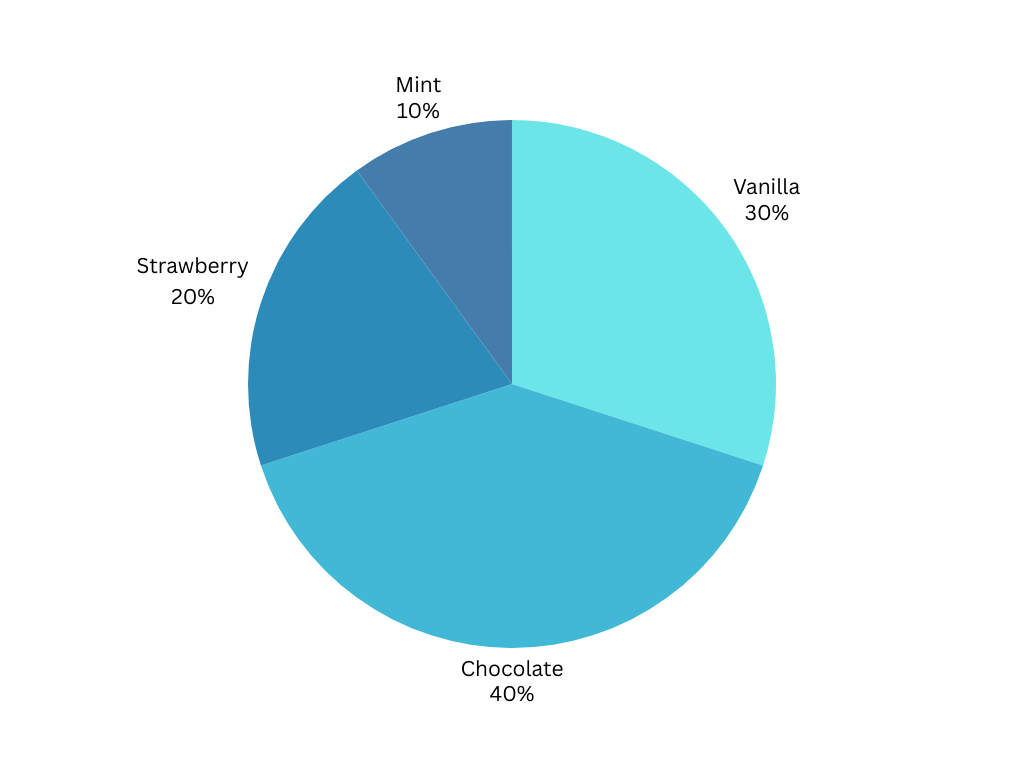
Suppose you have a pie chart showing “Favorite Ice Cream Flavors” among 100 students. The chart is divided into four flavors:
- Chocolate: 40%
- Vanilla: 30%
- Strawberry: 20%
- Mint: 10%
Step-by-Step Interpretation
- Read the title: “Favorite Ice Cream Flavors.”
- Notice the total must be 100%.
- Identify each flavor and its percentage:
- Chocolate: 40%
- Vanilla: 30%
- Strawberry: 20%
- Mint: 10%
- Determine which slice is largest and which is smallest.
- Conclude that chocolate is the most popular flavor at 40%, and mint is the least popular at 10%.
Practice Problem
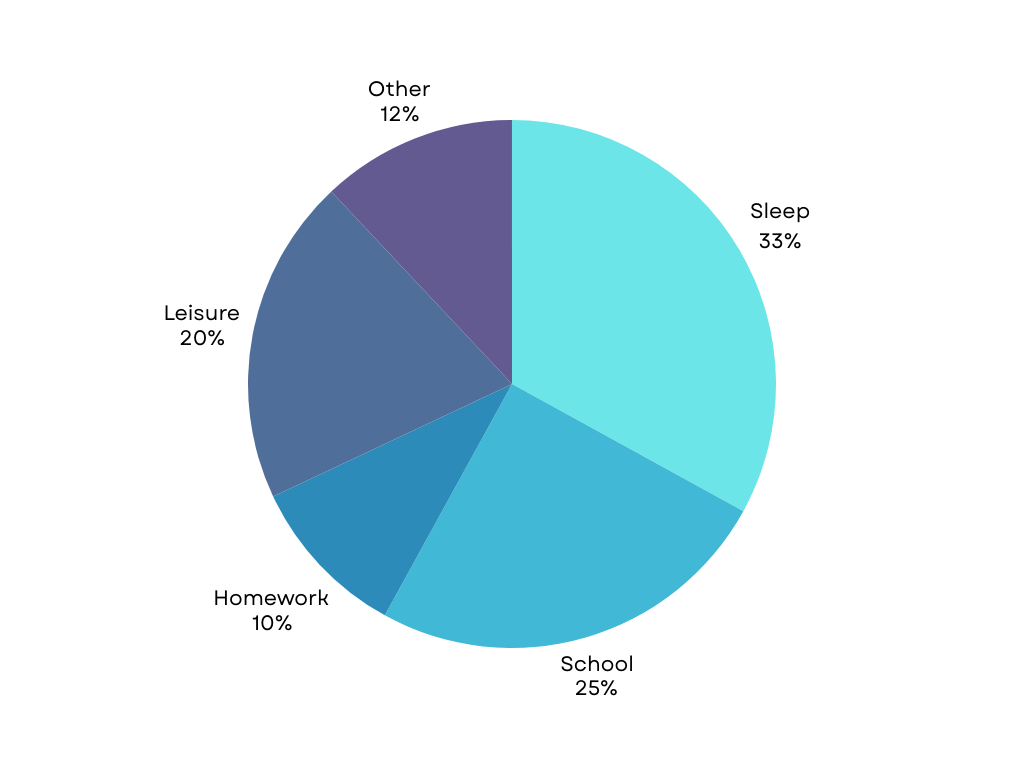
Consider a pie chart showing time spent on daily activities. The slices represent percentages of a 24-hour day:
- Sleep: 33%
- School: 25%
- Homework: 10%
- Leisure: 20%
- Eating and Other: 12%
Question: Which activity takes up the smallest slice, and how many hours does that translate to?
Solution Steps:
- Read the title: “Time Spent on Daily Activities.”
- Remember the total circle is 24 hours.
- Note each slice’s percentage: Sleep (33%), School (25%), Homework (10%), Leisure (20%), Eating and Other (12%).
- Find the smallest percentage: Homework (10%).
- Convert 10% of 24 hours: (10/100) × 24 = 2.4 hours.
- Answer: Homework is the smallest slice, with about 2.4 hours.
Line Graphs
A line graph uses points connected by lines to show changes over time or another continuous variable. It is useful for identifying trends, increases, or decreases in data.
Example of Line Graph
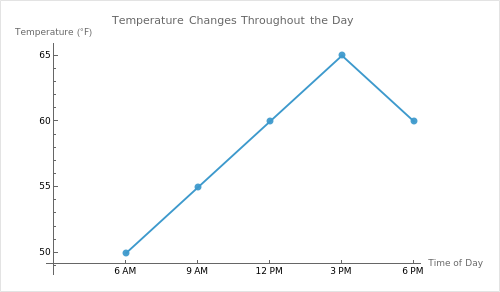
Consider this line graph labeled “Temperature Changes Throughout the Day.” It tracks the temperature at 6 AM, 9 AM, 12 PM, 3 PM, and 6 PM.
- 6 AM: 50°F
- 9 AM: 55°F
- 12 PM: 60°F
- 3 PM: 65°F
- 6 PM: 60°F
Step-by-Step Interpretation
- Read the title: “Temperature Changes Throughout the Day.”
- Look at the x-axis: time of day (6 AM, 9 AM, 12 PM, 3 PM, 6 PM).
- Look at the y-axis: temperature in °F.
- Notice how the data points connect:
- From 6 AM (50°F) to 9 AM (55°F) is a small increase.
- From 9 AM (55°F) to 12 PM (60°F) is another rise.
- From 12 PM (60°F) to 3 PM (65°F) is the peak.
- From 3 PM (65°F) to 6 PM (60°F) is a slight drop.
- Conclude that temperature increases throughout the morning and early afternoon, then begins to decrease by evening.
Practice Problem
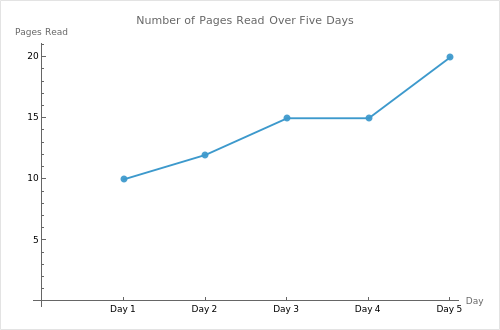
You have a line graph labeled “Number of Pages Read Over Five Days.” The x-axis shows Day 1 to Day 5, and the y-axis shows the number of pages:
- Day 1: 10 pages
- Day 2: 12 pages
- Day 3: 15 pages
- Day 4: 15 pages
- Day 5: 20 pages
Question: On which day(s) did the reading remain the same as the previous day?
Solution Steps:
- Read the title: “Number of Pages Read Over Five Days.”
- Check each data point: Day 1 (10), Day 2 (12), Day 3 (15), Day 4 (15), Day 5 (20).
- Compare each day to the previous day:
- Day 2 is 12 vs. Day 1’s 10 (increase).
- Day 3 is 15 vs. Day 2’s 12 (increase).
- Day 4 is 15 vs. Day 3’s 15 (no change).
- Day 5 is 20 vs. Day 4’s 15 (increase).
- Conclude that Day 4 stayed the same as Day 3.
How to Read a Graph
When reading any graph, it helps to follow a process:
- Check the title. This tells you the main topic.
- Identify the axes. The x-axis usually shows the category or time. The y-axis shows the values or measurements.
- Look at the scale and intervals. Notice if the scale jumps by 1, 5, 10, or another interval.
- Note any legend or key. If colors or patterns are used to represent different items, refer to the legend.
- Compare data points or bars. Identify patterns, such as peaks, valleys, or plateaus.
Example of Reading a Graph
Suppose you have a multi-line graph titled “Weekly Study Hours for Three Subjects.” The x-axis is labeled Week 1, Week 2, and Week 3. The y-axis shows hours studied. There is a legend showing:
- Red line = Math
- Blue line = English
- Green line = Science
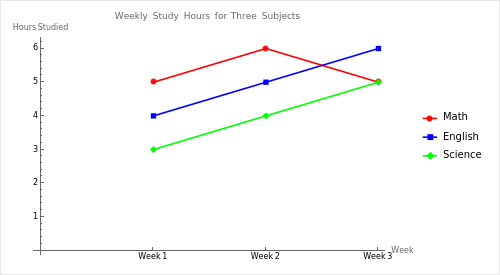
The data is as follows:
- Week 1: Math (5 hours), English (4 hours), Science (3 hours)
- Week 2: Math (6 hours), English (5 hours), Science (4 hours)
- Week 3: Math (5 hours), English (6 hours), Science (5 hours)
Step-by-Step Solution:
- Read the title: “Weekly Study Hours for Three Subjects.”
- Identify the x-axis (Weeks) and y-axis (Hours).
- Check the legend: Red = Math, Blue = English, Green = Science.
- Compare data points across weeks:
- Math decreases slightly from Week 2 (6 hours) to Week 3 (5 hours).
- English steadily increases over the three weeks (4 → 5 → 6).
- Science goes from 3 → 4 → 5.
- Conclude that English had the greatest increase and that, by Week 3, it has the highest number of study hours.
How to Read a Chart
Reading charts often involves scanning rows and columns, similar to reading a graph’s axes. However, charts can also combine numbers and text. Because of this, keep an eye on headings and footnotes.
- Check the title and column/row headings. This will help you understand what each row or column represents.
- Scan for totals or subtotals. Many charts include a total row that sums up all the data.
- Look for footnotes. They sometimes include important details about the data’s source or special conditions.
- Compare and contrast. See how each category lines up.
Example of Reading a Chart
Imagine a table labeled “High School Test Scores.” The rows represent different subjects (Math, English, Science, History). The columns are labeled “Average Score” and “Number of Students Tested”:
| Subject | Average Score | Number of Students Tested |
| Math | 80 | 50 |
| English | 85 | 45 |
| Science | 78 | 55 |
| History | 82 | 40 |
Step-by-Step Solution:
- Read the title: “High School Test Scores.”
- Notice the subjects in the first column.
- Look at the “Average Score” column. See that English has the highest average score at 85.
- Look at the “Number of Students Tested” column. Science has the highest participation with 55 students.
- Determine any trends: For instance, Math has a slightly lower average score (80) than English (85), but more students took Science than any other subject.
Practice Problem
Here is a chart labeled “Weekly Fruit Consumption.” The rows represent fruits (Apples, Oranges, Bananas), and the columns show “Number of Servings” and “Number of People Who Ate Them.”
| Fruit | Number of Servings | Number of People |
| Apples | 40 | 20 |
| Oranges | 30 | 15 |
| Bananas | 45 | 25 |
Question: Which fruit has the highest average servings per person?
Solution Steps:
- Read the title: “Weekly Fruit Consumption.”
- Check each row for the two columns.
- Calculate servings per person for each fruit:
- Apples: 40 servings ÷ 20 people = 2 servings per person.
- Oranges: 30 servings ÷ 15 people = 2 servings per person.
- Bananas: 45 servings ÷ 25 people = 1.8 servings per person.
- Compare the results: Apples and Oranges both average 2 servings per person, which is higher than Bananas at 1.8.
- Answer: Apples and Oranges tie for the highest average at 2 servings per person.
Quantitative Evidence: Connecting the Dots
When taking the SAT®, charts and graphs often appear alongside a passage. It is crucial to understand both the numbers and the text to answer questions accurately. The passage may explain trends shown in the chart or provide context that clarifies why the data matters.
- Always read any accompanying text or footnotes. They explain what the data represents.
- Look for keywords in the text, such as “increase,” “decrease,” or “trend.” These words often match changes in the visual.
- Pay attention to any disclaimers or sample sizes. A small sample might affect how reliable the data is.
Practice Makes Perfect
Even simple practice can build confidence. Consider reading a news article and examine any included charts or graphs. Next, try summarizing the main points in your own words (mentally or on paper). Over time, this habit will sharpen your ability to locate and interpret data.
Here are some resources and ideas to develop your skills:
- Check official SAT® sample questions and practice reading their data.
- Create your own charts from daily information, such as time spent on activities or weekly expenses.
- Compare visuals from reputable news outlets and see how data is presented differently.
Quick Reference Chart
Below is a quick reference chart with common terms and definitions related to quantitative evidence. Copy and paste this table into any document for a handy review.
| Term | Definition |
| Quantitative Evidence | Data expressed in numerical form, representing quantities. |
| Bar Graph | A visual representation of data using bars to compare different categories. |
| Pie Chart | A circular graph divided into sectors, showing the proportion of parts to a whole. |
| Line Graph | A graph that uses points connected by lines to show changes over time. |
| Axes | The horizontal (x-axis) and vertical (y-axis) lines on a graph that represent variables. |
| Legend | A key that explains the symbols, colors, or patterns used in a chart or graph. |
Conclusion
Reading and interpreting quantitative evidence are essential skills for the SAT® Reading and Writing Test, and these skills will continue to benefit you long after your exam. By mastering the steps to understand bar graphs, pie charts, line graphs, and various charts, you develop the ability to handle data-driven questions with confidence.
Remember, ongoing practice is vital. Revisit practice problems and gain comfort with different graph and chart types. Over time, you will see patterns more quickly and make accurate conclusions.
Keep exploring practice materials and official prep resources to boost your proficiency in reading charts and graphs. Look for exercises that blend visual and textual data so that you can fine-tune your skills in both areas. Mastery of these techniques will help you excel not only on the SAT®, but also in future academic and professional pursuits.
Sharpen Your Skills for SAT® Reading and Writing
Are you preparing for the SAT® Reading and Writing test? We’ve got you covered! Try our review articles designed to help you confidently tackle real-world SAT® Reading and Writing problems. You’ll find everything you need to succeed, from quick tips to detailed strategies. Start exploring now!
- Textual Evidence: SAT® Reading and Writing Review
- Central Idea: SAT® Reading and Writing Review
- Inferences: SAT® Reading and Writing Review
Need help preparing for your SAT® Reading and Writing exam?
Albert has hundreds of SAT® Reading and Writing practice questions and full-length practice tests to try out.


