Standard deviation is used to test variability in statistics by calculating the average distance from the mean of all the values in a data set. Another way to think of it is to ask, “How much do the values in this data set deviate from the mean value?”
The nuts and bolts of the equation are fairly simple—it just has a lot of different components to consider. This crash course will take you through how to calculate and interpret standard deviation. Then we’ll look at an example from the AP® Statistics test.
First Step: Calculating the Mean of a Data Set
In our example, the Smith family has five children. Let’s say we want to find the standard deviation from the mean age of the siblings. Our data set is the five children’s ages:
\{3,7,8,12,16\}
To find the standard deviation from the mean, we first need to know what our mean, or average, is. To calculate the mean, add each number in the data set:
3+7+8+12+16=46
Then divide your result by the number of values in your data set, or N. We have five values (for five Smith kids), so our N= 5.
\dfrac{46}{5} = 9.2
9.2, then, is our mean, or µ. The formula for finding the mean of a data set can also be expressed as:
Sample mean: \overline{x} =\dfrac{ \sum_a^b x }{n}
Population mean: \mu =\dfrac{ \sum_a^b x }{N}
Where \sum_a^b x is the sum of all the values in the data set; N is the number of values in the population, and n is the number of values in the data sample.
Notice that the mean symbol changes when referring to a sample mean versus the population mean. If you are taking the mean of a sample rather than the whole data set, you will want to use the x-bar symbol for mean rather than the µ. Since we are calculating the mean age of all the Smith children, we will use the µ.
You may also see the x in this equation written as . The superscript i simply means individual, telling you to consider each individual x value. Meanwhile, the sigma symbol, ∑, means you have to take the sum of something. So the formula tells you that the mean is equal to the sum of all the x values divided by N.
This may seem pretty basic, but understanding the code of this formula will make understanding the standard deviation formula that much easier.
Next: Calculating the Standard Deviation
The standard deviation is the average distance from the mean. Our µ = 9.2 for the values {3, 7, 8, 12, 16}. Therefore, we need to find the distance of each of those values from the mean, and then calculate the average distance.
The formula is one you’ll want to learn by heart, even though it’s included on the AP® Stats formula sheet. Make sure you include this one on your AP® Statistics study guide.
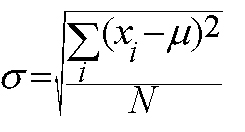
Image Source: Pittsburg State University
This formula represents the standard deviation from the µ. The i superscript is something you may or may not see written out in this equation; it just depends on how clear the writer wants to be. The superscript simply means to take the sum of each individual point in the data set.
Since we’re working with the whole population of Smith children, this is the formula we’ll cover first. Later, we’ll cover the formula for a sample mean. Let’s set up the equation for our data set and go through it step by step:
\sigma =\sqrt{ \dfrac{ \sum_a^b x\big(3-9.2)^{2}+ \big(7-9.2\big)^{2}+ \big(8-9.2\big)^{2}+ \big(9.2-9.2\big)^{2}+ \big(12-9.2\big)^{2}+ \big(16-9.2\big)^{2}}{5} }
\sigma =\sqrt{ \dfrac{38.44+4.84+0+7.84+46.2}{5} }
\sigma =\sqrt{ \dfrac{98.8}{5} }
\sigma = 4.45
Our standard deviation is 4.45. That means that each Smith child is an average distance of 4.45 years away from the mean age of all the Smith children.
That’s the basic formula for standard deviation. If you need to find the standard deviation of a sample mean, refer to this formula:
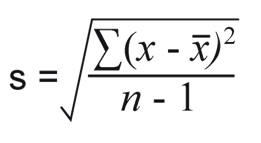
Image Source: Mathematical Musings
The main difference here, apart from the use of the s for sample standard deviation and the x-bar symbol for sample mean, is the n – 1. A lower-case n refers to the sample population while a capital N refers to the total population and n – 1 adjusts for the difference between the sample and the whole.
Interpreting the Standard Deviation
A high standard deviation generally means that the data points are widely scattered from the average while a low standard deviation means that the data points are closer to the mean. This allows you to compare results within a population group. It also allows you to compare standard deviation in results between different population groups. This is particularly useful if you are attempting to reproduce your results in a scientific study.
Say, for instance, that you are testing response times of participants in a driving simulation. The control group is well rested while the 3 experimental groups have had 6, 4, and 2 hours of sleep respectively. The standard deviation in their response times would give valuable insight into how erratic drivers become when sleep-deprived.
Standard deviation can also be expressed graphically:
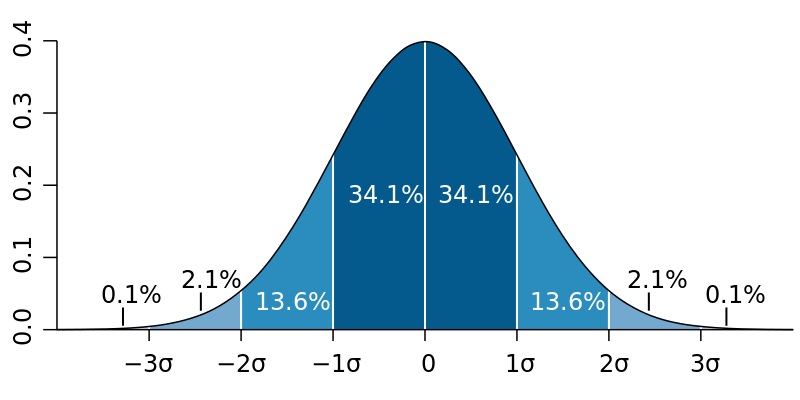
In this figure, the x-axis represents the difference in standard deviations from the mean, while the y-axis represents the percentiles of the data set. On the x-axis, the 0 is the mean. The points to its left are -1, -2, and -3 standard deviations from the mean, and vice versa on the right. This graph tells us that 34.1% of this data set falls between -1 and 1 standard deviation from the mean, while a mere 0.1% falls outside of -3 and 3.
Standard Deviation on the AP® Statistics Test
On the AP® Statistics test, you will be given all the relevant standard deviation formulas on the AP® Stats formula sheet. The questions on the test will ask you to demonstrate your knowledge of standard deviation and interpret it in the context of a practical problem. Often, this means using a given standard deviation to calculate another value in a different formula. Take, for instance, this question from the FRQ portion of the 2009 AP® Stats exam.
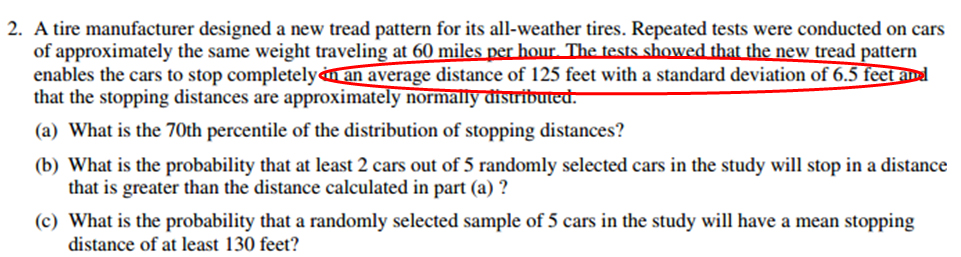
This question asks a student to apply the concept of standard deviation in context to determine other information about the tire treads. The red circle marks the most important information you need for this problem. Once we use the standard deviation to find the 70th percentile, we can use that answer to solve parts b and c.
First, we need to get the z-score for 70 percent—another calculation which involves the standard deviation. The formula to find the z-score is:
\dfrac{ \big(x- \mu \big) }{ \sigma }
For our example, that gives us:
\dfrac{ \big(x- 125\big) }{6.5} = 0.52
So for 70 percent, z = 0.52. We already have the standard deviation, so we can plug both values into this formula for calculating percentile:
x =\mu + \big(z\big) \big( \sigma \big)
Written out with the values for this problem, that becomes:
Let’s see how the student in this example used that formula to complete the problem:
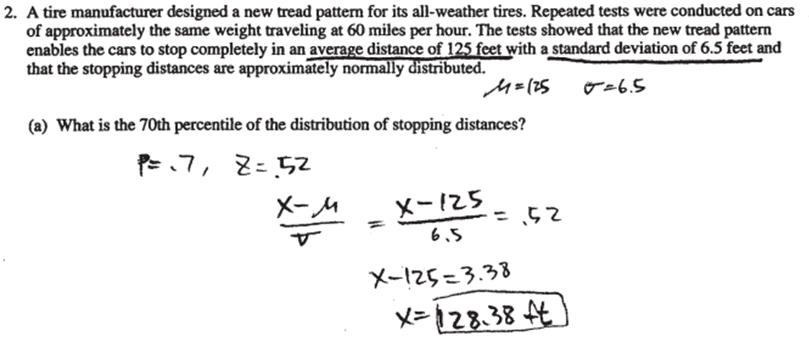
This particular test-taker also underlined the same information that we circled in red above and wrote out the mean, standard deviation, p, and z-score needed to complete the problem. This test-taking strategy lets you organize your thoughts and mark relevant information in a question clearly. It also spells out your process for the examiners, who can follow along with your work.
Wrapping Up Standard Deviation
Standard deviation is one of the most important and frequently used statistics we can find—whether used on its own to tell us something about a data set or as part of an equation to find percentile or other information. As a rule of thumb, remember that high standard deviation means lots of variation from the mean and may be caused by factors such as outliers or a more scattered data set while low standard deviation tends to mean less variation from the mean and a more homogeneous data set.
Let’s put everything into practice. Try this AP® Statistics practice question:
Looking for more AP® Statistics practice?
Check out our other articles on AP® Statistics.
You can also find thousands of practice questions on Albert.io. Albert.io lets you customize your learning experience to target practice where you need the most help. We’ll give you challenging practice questions to help you achieve mastery of the AP® Statistics.
Start practicing here.
Are you a teacher or administrator interested in boosting AP® Statistics student outcomes?
Learn more about our school licenses here.


